WaveCalib
Overview
This file describes the data model for the WaveCalib.
The images are written to disk as a multi-extension FITS file
prefixed by WaveCalib in the Calibrations/ folder.
See Calibration Frame Naming for the naming convention.
Inspecting
pypeit_chk_wavecalib
You can print a set of simple diagnostics to the screen with the pypeit_chk_wavecalib script, e.g. :
$ pypeit_chk_wavecalib Calibrations/WaveCalib_A_1_MSC03.fits

 N. SpatID minWave Wave_cen maxWave dWave Nlin     IDs_Wave_range    IDs_Wave_cov(%) measured_fwhm  RMS
--- ------ ------- -------- ------- ----- ---- --------------------- --------------- ------------- -----
  0     35  6422.5   7753.8  9053.2 0.325   48  6508.325 -  9047.930            96.5           3.5 0.046
  1     93  6310.0   7641.4  8940.8 0.325   49  6336.179 -  8931.145            98.6           3.6 0.036
  2    140  6440.8   7772.1  9071.5 0.325   47  6508.325 -  9047.930            96.5           3.6 0.049
  3    184  6301.2   7632.6  8932.0 0.325   50  6306.533 -  8931.145            99.8           3.6 0.037
  4    243  6257.1   7588.5  8887.9 0.325   49  6268.229 -  8821.832            97.1           3.6 0.034
SpatIDis the spatial position of the slit/order.minWave,maxWave,Wave_cen,dWaveare, respectively, the minimum wavelength value, the maximum wavelength value, the central wavelength, and the wavelength dispersion of the calibrated arc spectra. All the values are in Angstrom.Nlin,IDs_Wave_range,IDs_Wave_cov(%)are, respectively, the number, the wavelength range, and the spectral coverage of the identified and fitted arc lines.measured_fwhmis the measured arc lines FWHM (in binned pixels of the input arc frame), i.e, the approximate spectral resolution. Note that this not necessarily thefwhmused to identify the arc lines during the wavelength calibration, see FWHM.RMSis the RMS of the wavelength solution (in pixels).
PNGs
At present, the only way to visually examine the quality of this step is by viewing the PNG file generated by the code. PypeIt QA describes how to access them.
There is 1 PNG file generated per slit. Here is an
example from the shane_kast_red spectrograph.
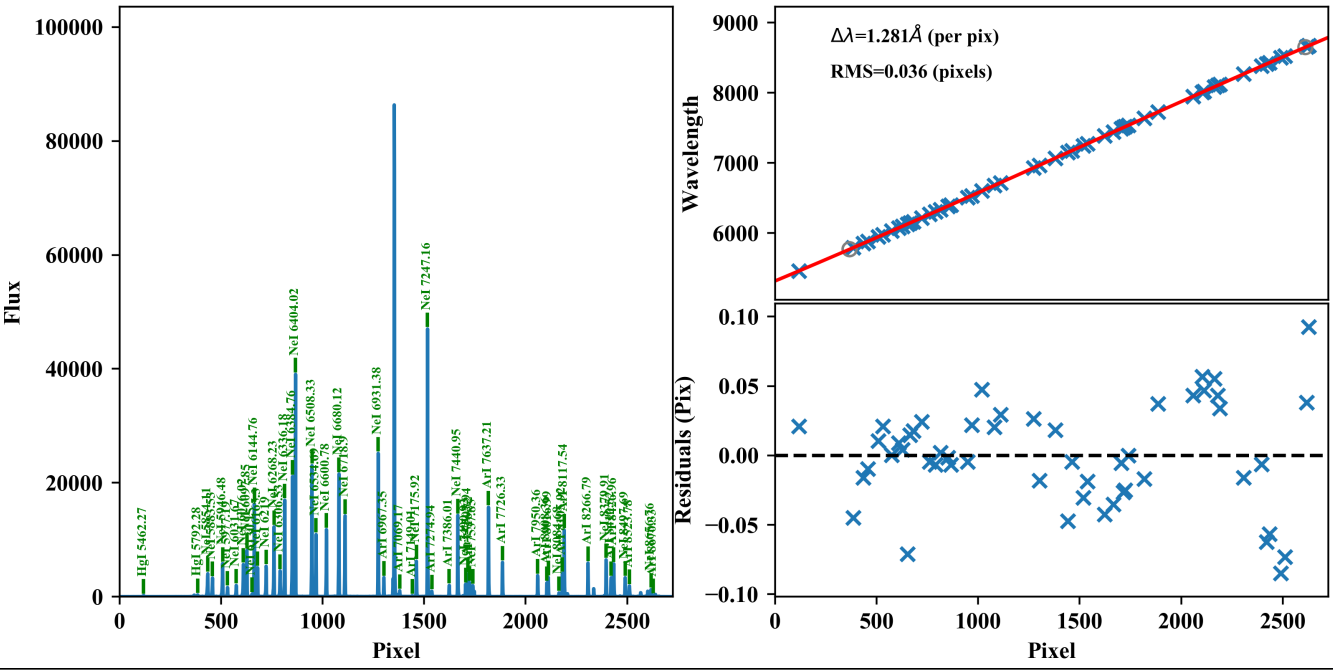
What you hope to see in your QA is:
On the left, many of the blue arc lines marked with IDs
In the upper right, an RMS < 0.1 pixels
In the lower right, a random scatter about 0 residuals
Troubleshooting
Wavelength solutions are amongst the most challenging part of data reduction. See Wavelength Calibration for extensive details on how PypeIt performs wavelength calibration and related issues.
Current WaveCalib Data Model
Internally, the image is held in
pypeit.wavecalib.WaveCalib
which subclasses from pypeit.datamodel.DataContainer.
The datamodel written to disk is:
Version 1.1.2
HDU Name |
HDU Type |
Data Type |
Description |
|---|---|---|---|
|
… |
Empty data HDU. Contains basic header information. |
|
|
integer |
Slit spat_ids. Named distinctly from that in WaveFit |
|
|
… |
|
|
|
… |
||
… |
… |
… |
… |
|
floating |
2D array: 1D extracted spectra, slit by slit (nspec, nslits) |