PypeIt Setup GUI Tutorial
Overview
The PypeIt Setup GUI provides an interactive, graphical interface for creating and editing PypeIt input files (.pypeit files). This GUI-based approach is particularly helpful for first-time users and provides a visual way to organize and inspect your raw data before running reductions.
The Setup GUI performs the same core functions as the command-line pypeit_setup script, but with an interactive interface that allows you to:
Select a spectrograph
Specify raw data directories
Automatically scan and organize raw data files.
Create an observation log
Create and manage .pypeit configuration files
Edit data tables and frame types
Save your .pypeit file for reduction
Launching the Setup GUI
There are two ways to launch the Setup GUI:
Method 1: Using the -G flag with pypeit_setup
pypeit_setup -G
This launches the GUI with a blank slate, allowing you to configure everything interactively.
Method 2: Pre-populate with command-line arguments
You can also launch the GUI with some initial settings:
pypeit_setup -G -s keck_deimos -r /path/to/raw/data
- This will:
Start the GUI with the spectrograph already selected (keck_deimos)
Pre-populate the raw data directory path
Automatically run the setup scan when the GUI opens
The GUI Interface
The Setup GUI window consists of several main components:
Main Window Components
Button Bar (top of window)
Open: Open an existing .pypeit file
Clear: Clear everything and start fresh
Run Setup: Scan raw data directories and generate observation log and .pypeit files for each setup.
Save Tab: Save the currently active tab
Save All: Save all tabs with unsaved changes
Help: Opens PypeIt Setup GUI tutorial
View log: Opens a window showing the application log
Exit: Quit the application
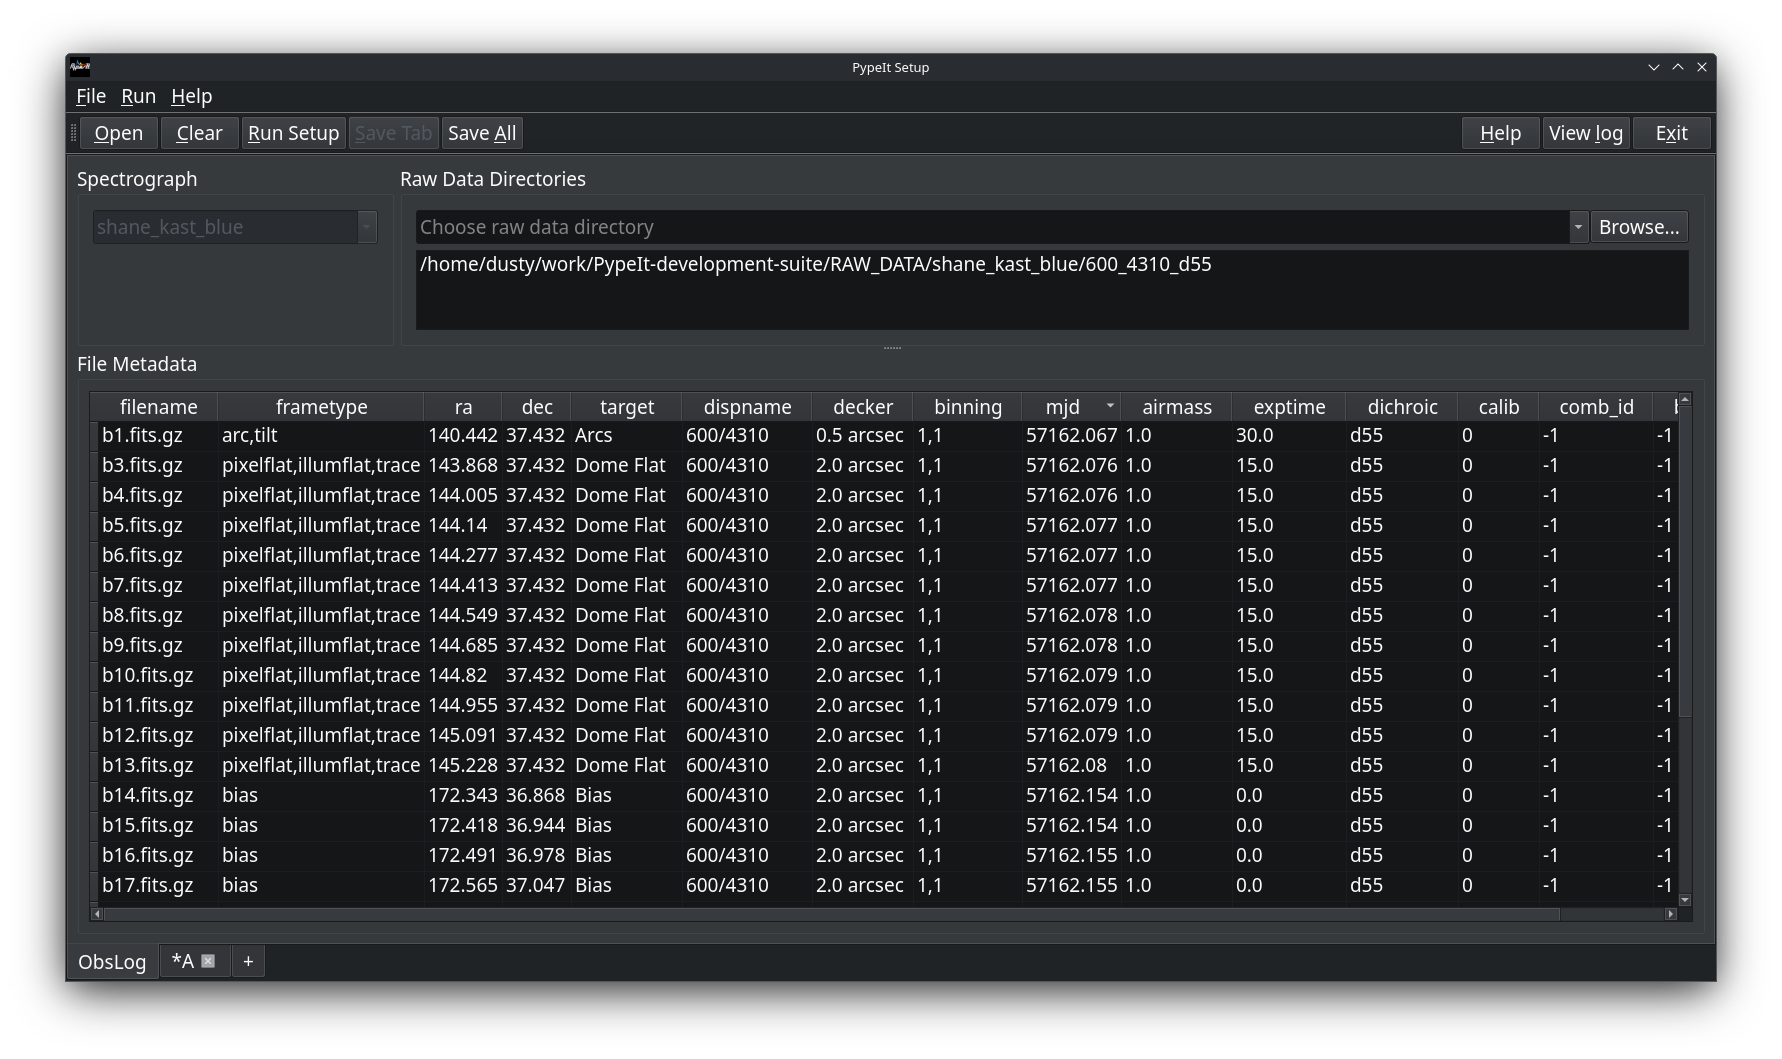
Main View (obslog tab)
Spectrograph Selector: (top left) Drop-down menu to choose your instrument
Raw Data Directories: (top right) Area to add one or more directories containing raw FITS files
Observation Log Table: (central) Displays metadata from all raw files after scanning
PypeIt File Tabs
After running setup, additional tabs appear for each unique instrument configuration detected (labeled A, B, C, etc.). Each tab represents a .pypeit file.
Basic Workflow
Step 1: Select Your Spectrograph
Click on the Spectrograph drop-down menu
Select your instrument from the list of available spectrographs (e.g., keck_deimos, keck_lris_blue, vlt_fors2)
You can also type to search through the spectrograph list
The spectrograph selection determines how PypeIt will interpret your raw data files and what metadata fields to extract.
Step 2: Add Raw Data Directories
In the Raw Data Directories section, type the folder containing your raw FITS files or press the Browse button to bring up a dialog box to choose the directory.
You can add multiple directories if your data is spread across different locations.
Previously used directories appear in a dropdown for quick access.
Note
The directories can contain data from multiple observing configurations. PypeIt will automatically parse and separate them in the next step.
Step 3: Run Setup
Click the Run Setup button
PypeIt will scan all specified directories for raw data files
The observation log table will populate with metadata from each file
New tabs will appear for each unique instrument configuration detected
The setup process:
Identifies all raw files matching the spectrograph’s allowed extensions
Extracts metadata from FITS headers
Groups files by instrument configuration
Assigns frame types (science, arc, flat, bias, etc.)
Creates a separate .pypeit file tab for each configuration
Tip
The scan may take a few moments depending on the number of files. Watch the progress bar or log window for progress.
Step 4: Inspect the Observation Log
After setup completes, examine the observation log table:
Columns: Display metadata like filename, frame type, target, exposure time, filter, etc.
Sorting: Click column headers to sort
Frame Types: Verify PypeIt correctly identified science, calibration, and standard frames
Configurations: Different setups (grating angles, filters, etc.) are separated into different tabs
Warning
Always check that frame types are correctly assigned! Misidentified frames can cause reduction failures.
Step 5: Edit PypeIt File Tabs
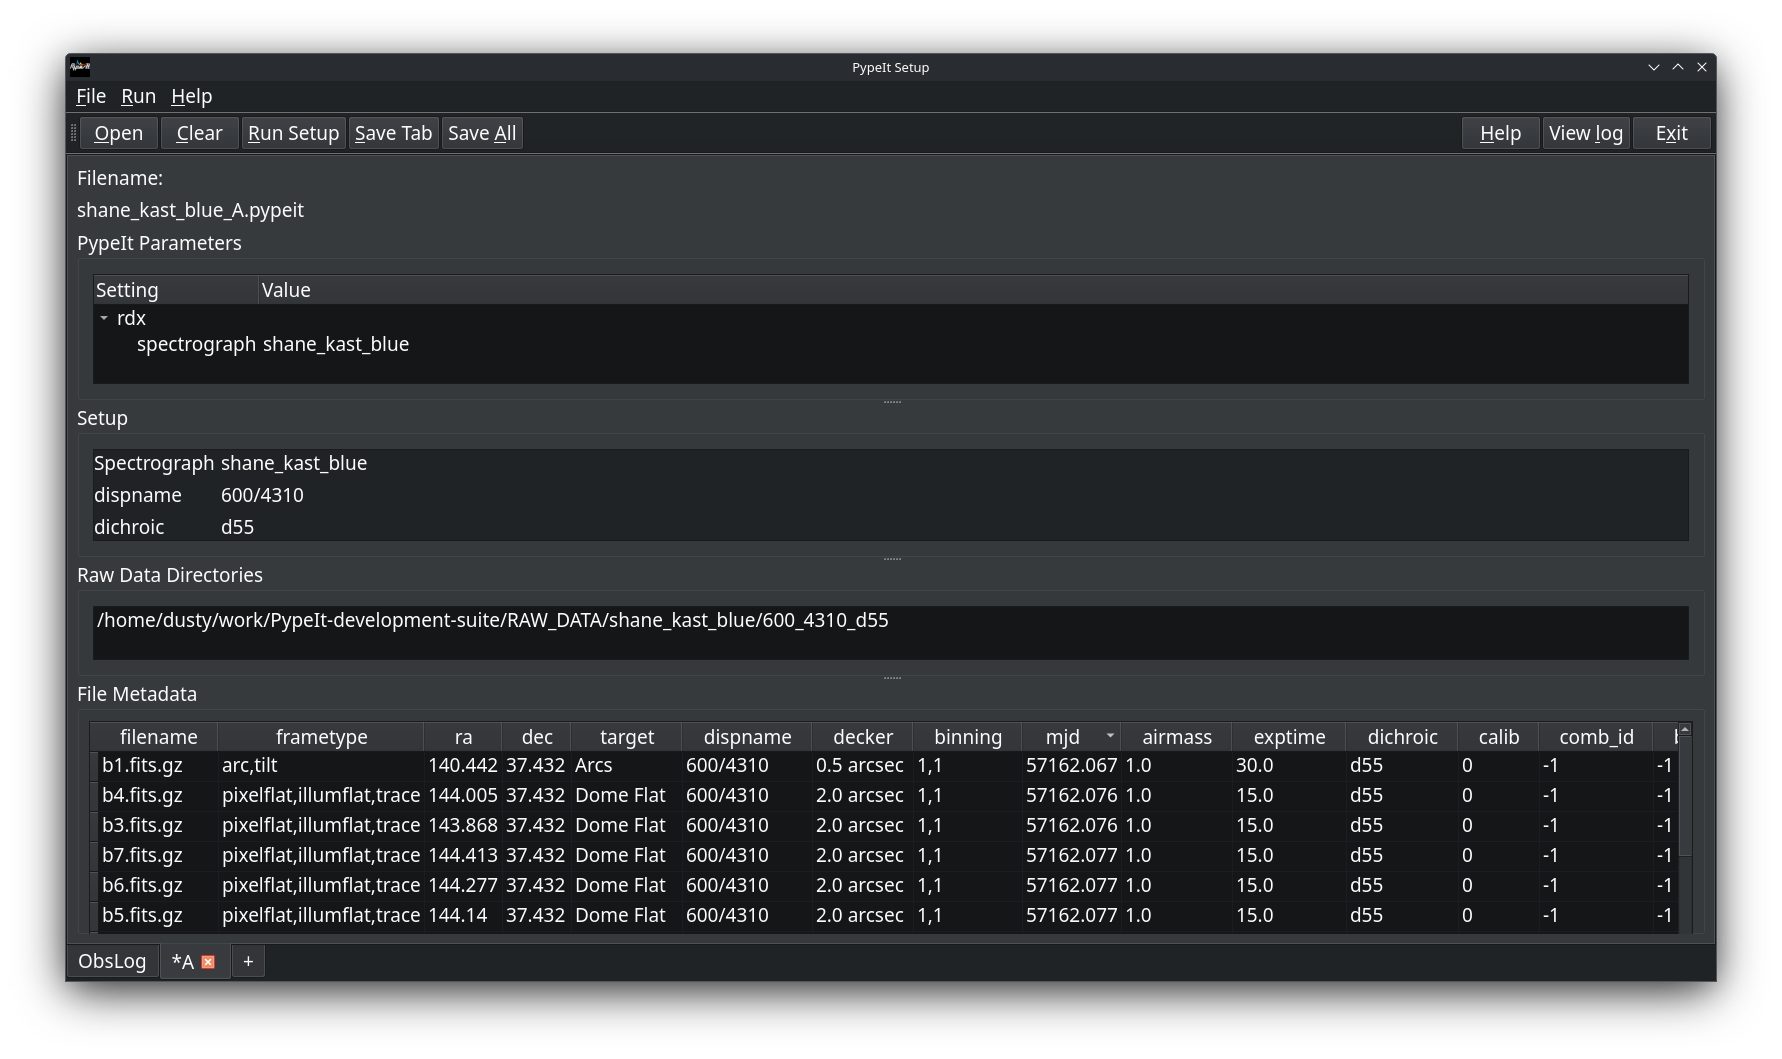
Click on the configuration tabs (A, B, C, etc.) to view and edit the .pypeit files:
Configuration Tab Features:
Parameter Block: Shows the PypeIt reduction parameters
Data Table: Modify frame types, add background pairs.
Setup Block: View the instrument configuration parameters
Common Edits:
Change frame types if PypeIt misidentified them
Update the background pair columns (comb_id, bkg_id)
- To edit frame types:
Click on a cell in the frametype column
Check the correct frame type in the pop up list of types
Multiple types can be selected and will appear as comma-separated in the metadata (e.g., arc,tilt)
Step 6: Save Your Setup
When you’re satisfied with your configuration:
Save Tab: Saves only the currently displayed tab
Save All: Saves all tabs that have unsaved changes
The GUI will prompt you to specify the location for each .pypeit file. By default, files are named using the convention:
<spectrograph>_<setup>.pypeit
For example: keck_deimos_A.pypeit, keck_deimos_B.pypeit
Additional Features
Opening Existing PypeIt Files
To load and edit an existing .pypeit file:
Click Open button
Navigate to your .pypeit file
The file contents will load into a new tab
Edit as needed and save changes
Note
Opening a .pypeit file will also load the ObsLog tab for the raw data directories mentioned in the file.
Viewing Raw Data
To view the raw data files in Ginga, right click on the file in the File Metadata table and select “Viiew File”. Then select which detector you wish to view.
You can also view the FITS header for the raw data files by right clicking on the file and selecting “View Header”.
Working with Multiple Configurations
If PypeIt detects multiple instrument configurations:
Each configuration gets its own tab (A, B, C, etc.)
Configurations differ by grating, filter, binning, or other setup parameters
You can edit and save each configuration independently
All configurations share the same raw data pool
Closing Tabs
To close a configuration tab:
Click the X on the tab
The GUI will prompt you to save if there are unsaved changes
The ObsLog tab cannot be closed
Viewing Logs
Click the View log button to see:
Setup operations and their status
File scanning progress
Any warnings or errors encountered
Metadata extraction details
This is helpful for debugging if something doesn’t work as expected.
Example Walkthrough
Here’s a complete example using Keck DEIMOS data:
# Launch the GUI
pypeit_setup -G
In the GUI:
Select spectrograph: keck_deimos
Add raw data directory: /data/DEIMOS/2024mar15/raw
Click Run Setup
Wait for scan to complete (watch the log)
Review the ObsLog tab - verify all expected files are present
Click on Configuration A tab
Inspect frame types in the data table
Make any necessary edits to frame types
Click Save Tab
Choose the location for the file. The file will be named keck_deimos_A.pypeit
Click Exit
Your setup is now ready! Run the reduction with:
run_pypeit keck_deimos_A.pypeit
Tips and Best Practices
Organizing Your Data
Keep raw data in a dedicated directory
Use a separate working directory for reductions
Checking Frame Types
Always verify frame type assignments. Common frame types are:
science: Target observations
arc: Wavelength calibration lamps
flat: Flat field exposures (dome or internal)
bias: Bias frames
dark: Dark current frames
trace: Used for slit/order tracing (often same as flat)
pixelflat: Used for pixel-to-pixel sensitivity
standard: Standard star observations for flux calibration
illumflat: Flat-field exposure used for illumination flat
tilt: Exposure used to trace the tilt in the wavelength solution
Multiple frame types can be selected and are displayed separated by commas e.g., arc,tilt. For a full list of frame types see Frame Types.
Handling Edge Cases
- Multiple setups: If you have multiple configurations but don’t want to reduce all of them:
Only save the tabs you need
Close unwanted configuration tabs
Or run setup with the -c flag to pre-select specific configurations
- Large datasets: For very large datasets (hundreds of files):
The initial scan may take some time
Consider splitting into separate reduction directories by configuration
Use the log viewer to monitor progress
Troubleshooting
GUI Won’t Launch
If the GUI fails to start:
Check that you have Qt dependencies installed (PyQt6)
Verify your PypeIt installation is up to date
Check for error messages in the terminal
No Files Found
If “Run Setup” finds no files:
Verify the raw data directory path is correct
Check that files have allowed extensions (.fits, .fits.gz, etc.)
Ensure the spectrograph is correctly selected
Look at the log for detailed scanning information
Setup Fails
If setup scanning fails or crashes:
Check the log viewer for error messages
Verify raw files are readable and not corrupted
Ensure FITS headers contain expected keywords
Try running command-line pypeit_setup to see more detailed errors
See Also
run_pypeit: Running the actual data reduction
Calibrations: Understanding calibration frames
Command-line alternative: pypeit_setup