Tilts
Overview
This file describes the data model for the Tilts.
The images are written to disk as a multi-extension FITS file
prefixed by Tilts in the Calibrations/ folder.
See Calibration Frame Naming for the naming convention.
Inspecting
To examine the quality of this step the user can run the pypeit_chk_tilts script, or inspect the PNG files generated by the code. PypeIt QA describes how to access them.
pypeit_chk_tilts
There are currently 2 options for viewing the traced and 2D fitted tilts on the image used to construct them. Each uses the pypeit_chk_tilts script.
ginga
This is the default mode when executing, e.g.:
pypeit_chk_tilts Calibrations/Tilts_A_0_DET01.fits
The Tiltimg image is shown in ginga with the traced and 2D fitted tilts over-plotted.
Here is a zoom-in screen shot for the shane_kast_red spectrograph.
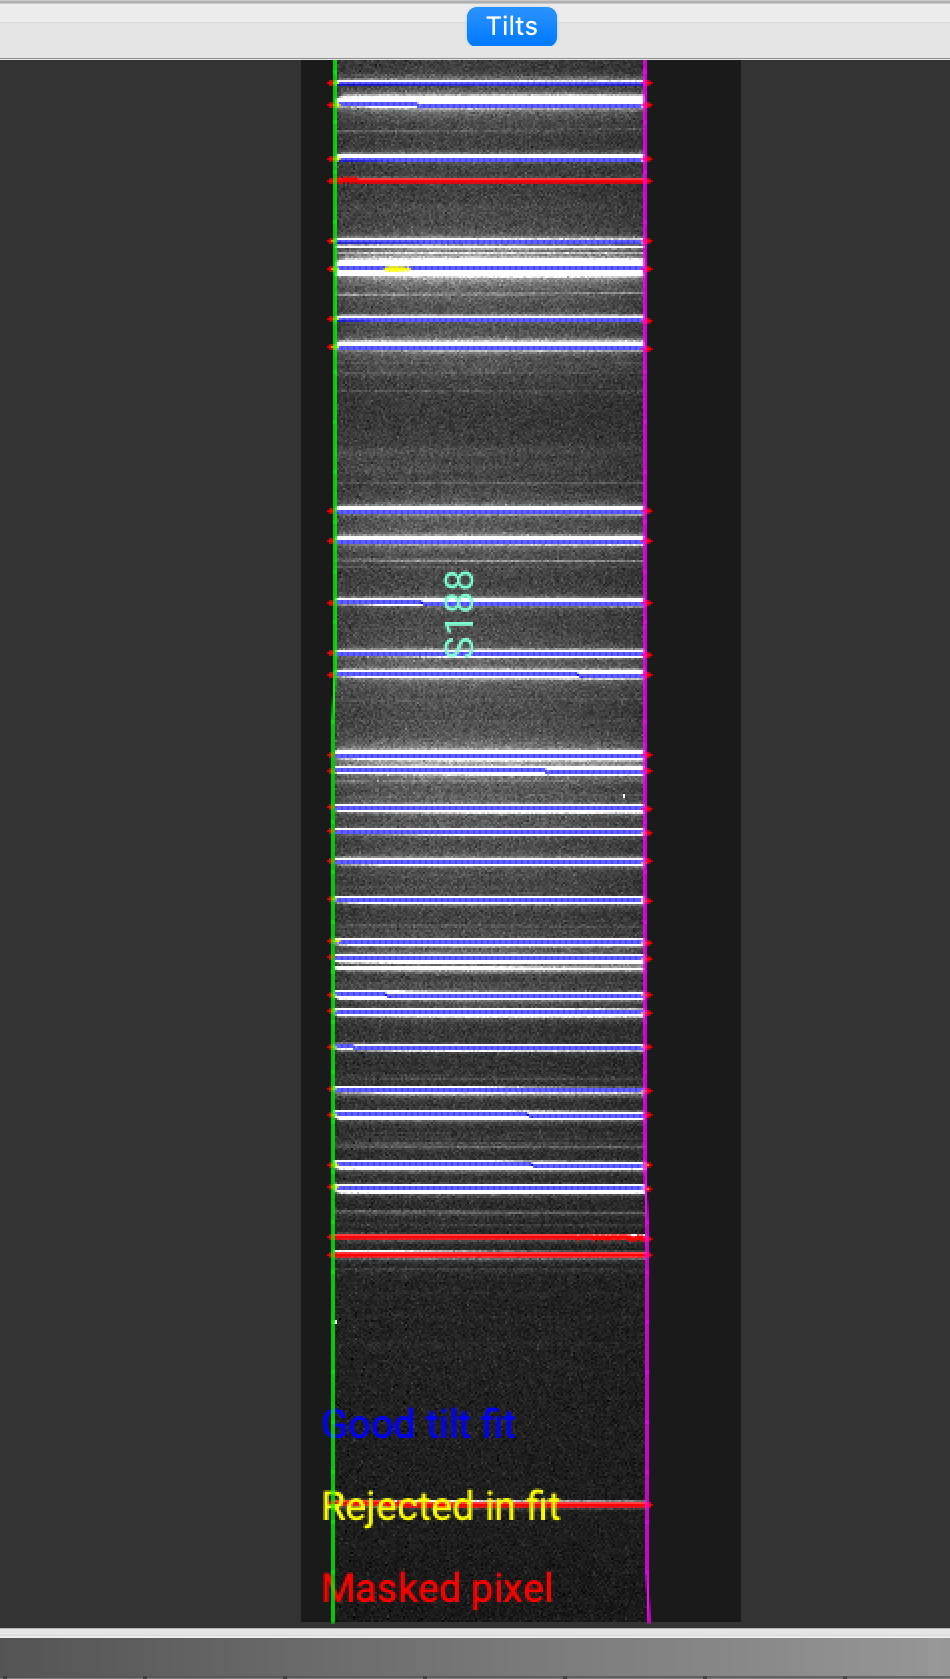
You want to check that the traced and 2D fitted tilts overlay well on the arc/OH lines.
matplotlib
To avoid ginga, use the –mpl flag:
pypeit_chk_tilts Calibrations/Tilts_A_0_DET01.fits --mpl
QA PNG files
There are 3 PNG files generated per slit:
2D Arc Tilts
This QA shows the spectral vs. spatial positions of all
the lines traced by the code. Here is an example
from shane_kast_red:
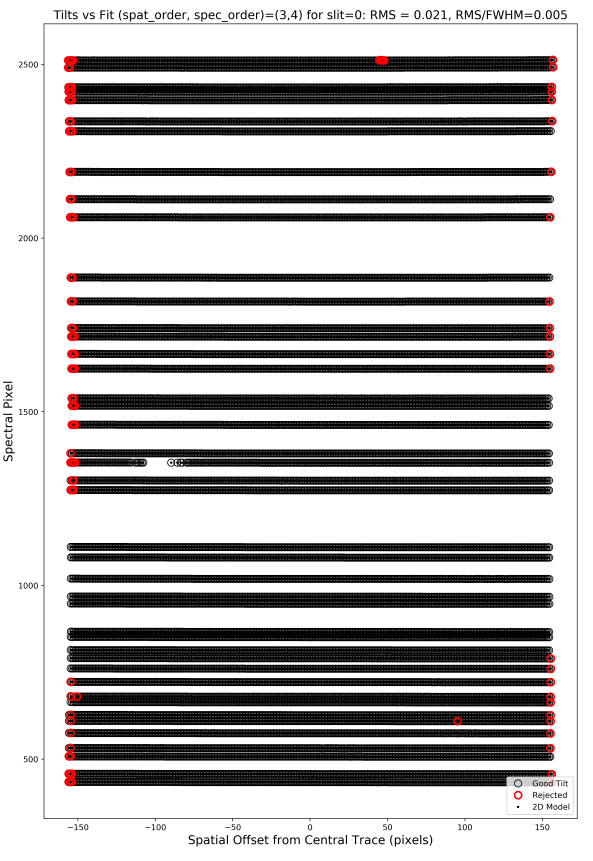
Here is what you hope to see in this QA:
RMS < 0.1
Very few red points
The red points are mainly at the very edges of the black lines
The black points span across the full detector
On the last point, if only a smaller portion of the detector is covered, the code is extrapolating. Indeed, the example above only shows outputs down to ~480 Spectral Pixel, which is not ideal. Of course, this will be the case for spectrographs that have data which does not span the full detector.
Spat Tilts
This QA examines the residuals of (tilt position - model)
as a function of spatial offset along the slit. Here
is an example from shane_kast_red:
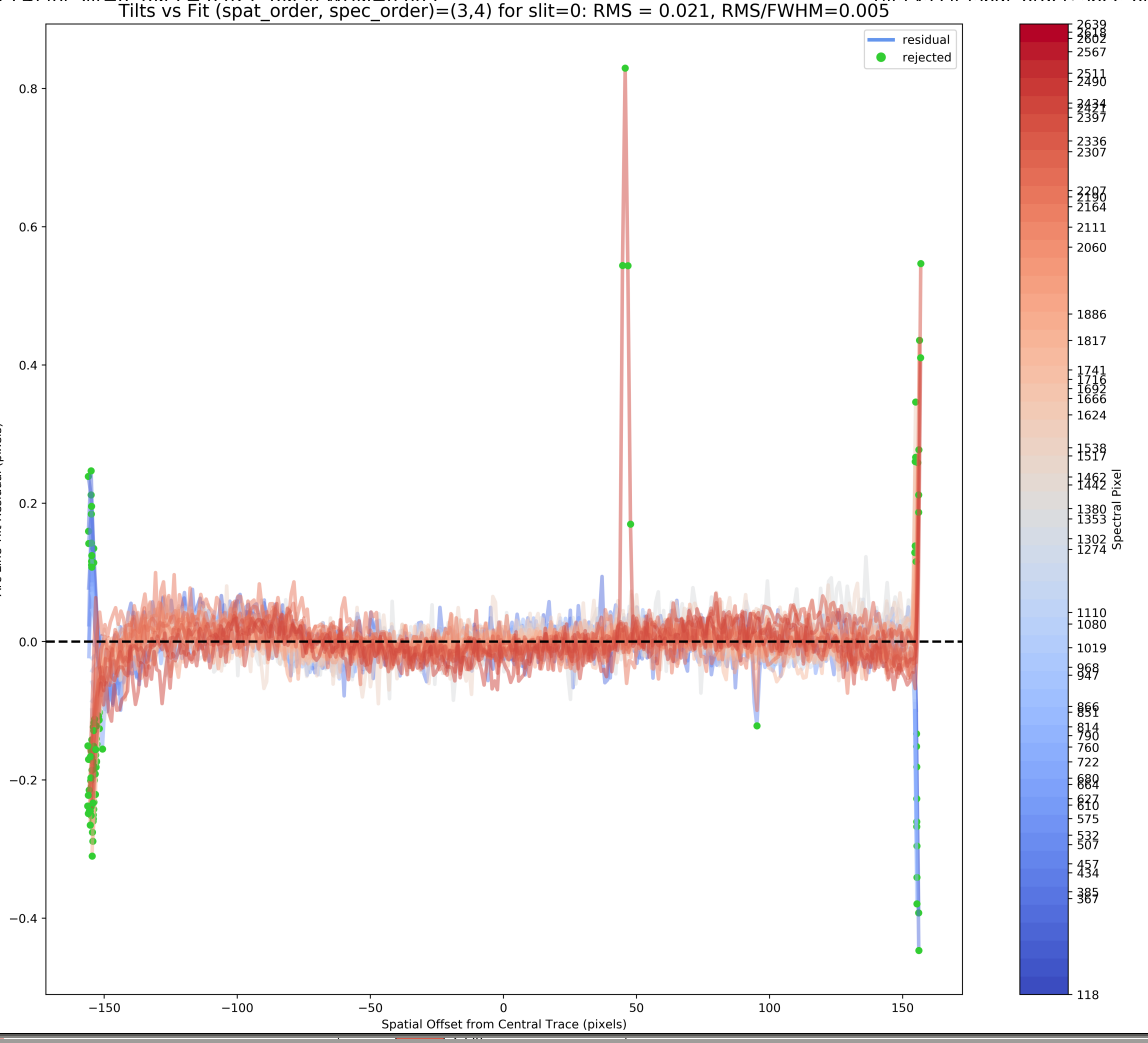
One hopes to see small residuals without any substantial spatial dependence. But, it is common for there to be significant residuals at the edges of the slit (as in this example).
Spec Tilts
This QA examines the residuals of (tilt position - model)
as a function of spetral offset along the slit. Here
is an example from shane_kast_red:
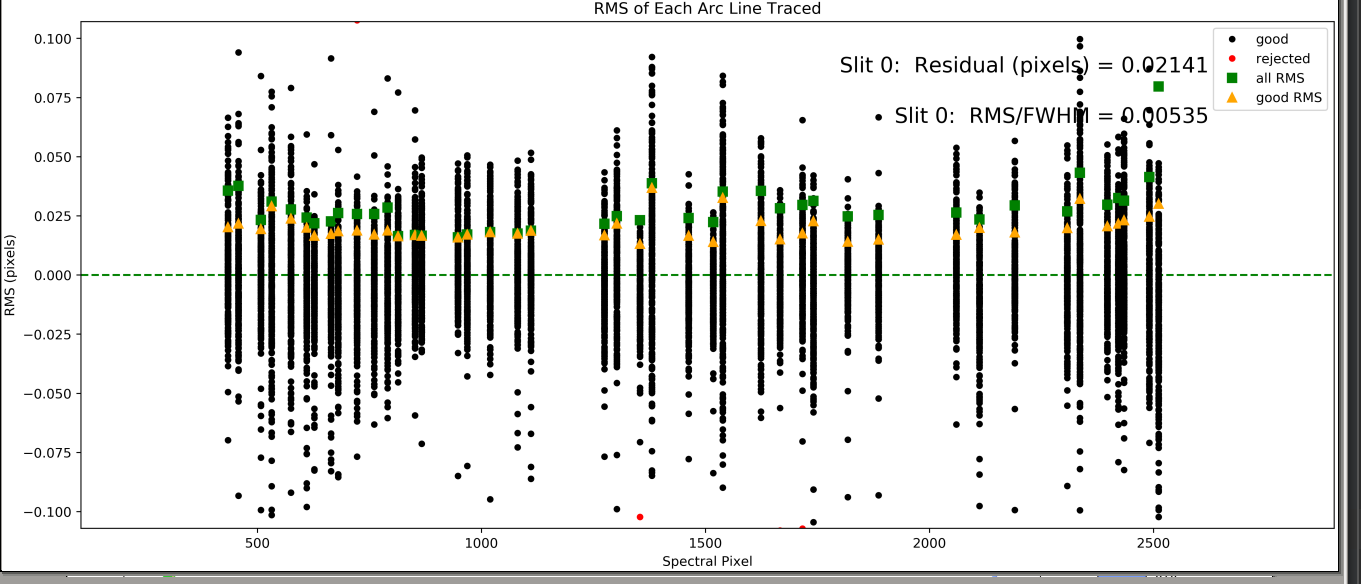
One hopes to see:
The black points scattering about 0
The orange and green points not too far above 0
Troubleshooting
If one or more of your image appears to be in err, here are the things to consider:
Insufficient Lines
Todo
Explain how to add more
Current WaveTilts Data Model
Internally, the image is held in
pypeit.wavetilts.WaveTilts
which subclasses from pypeit.datamodel.DataContainer.
The datamodel written to disk is:
Version 1.2.0
HDU Name |
HDU Type |
Data Type |
Description |
|---|---|---|---|
|
… |
Empty data HDU. Contains basic header information. |
|
|
… |
Tilts data; see |
TILTS content is:
Version: 1.2.0
Attribute |
Type |
Array Type |
Description |
|---|---|---|---|
|
str |
PypeIt spectrograph name |
|
|
Bad pixel mask for tilt solutions. Keys are taken from SlitTraceSetBitmask |
||
|
2D coefficents for the fit on the initial slits. One set per slit/order (3D array). |
||
|
str |
Function used for the 2D fit |
|
|
int |
Total number of slits. This can include masked slits |
|
|
str |
Path to SlitTraceSet file. This helps to find the Slits calibration file when running pypeit_chk_tilts() |
|
|
float |
Flexure shift from the input TiltImage |
|
|
Slit spat_id |
||
|
Order for spatial fit (nslit) |
||
|
Order for spectral fit (nslit) |
||
|
Table with the positions of the traced and fitted tilts for all the slits. see |
||
|
str |
Path to Tiltimg file. This helps to find Tiltimg file when running pypeit_chk_tilts() |