Slit Tracing
Overview
One of the first and most crucial steps of the pipeline is to auto-magically identify the slits (or orders) on a given detector. This is a challenging task owing to the wide variety in:
the number of slits/orders,
the separation between slits/orders (if any)
the varying brightness of flats across the detector
Developing a single algorithm to handle all of these edge cases (pun intended) is challenging if not impossible. Therefore, there are a number of user-input parameters that one may need to consider when running PypeIt (see below Known Slit Tracing Issues and Slit Tracing Customizing).
Underlying the effort is the EdgeTraceSet class; see
auto_trace() for a description of the
algorithm.
Slit-mask design matching
PypeIt can incorporate information about the slit-mask design into the
slit-tracing process. This is primarily performed by
pypeit.edgetrace.EdgeTraceSet.maskdesign_matching(), which matches
the slit edges traced by PypeIt to the slit edges predicted
using the slit-mask design information stored in the observations.
Moreover, maskdesign_matching()
uses the predicted slit edges positions to add slit traces that have
not been detected in the image.
This functionality at the moment is implemented only for these
Slit-mask design Spectrographs and is switched on by setting
use_maskdesign flag in EdgeTracePar Keywords to True. Other parameters
may need to be adjusted as well, depending on the instrument (see
Slitmask ID assignment and missing slits and the relevant instrument documentation pages).
Slit-mask design Spectrographs
Keck LRIS (limited)
Gemini GMOS (limited)
Viewing
See Edges and Slits for notes on how to view the outputs related to Slit Tracing.
One can also run the pypeit_parse_slits script on the Slit output
to get a terse description of the output.
Scripts
pypeit_trace_edges
Slit tracing is one of the steps in PypeIt that can be run independently of
the full reduction, using the pypeit_trace_edges script. If you’re having
difficulty getting the slit tracing to perform as desired, we recommend you
troubleshoot the tracing using this script.
pypeit_trace_edges can be run just by providing a trace image; however, this
approach hasn’t been well tested and may lead to different results from what
you get with run_pypeit. Instead, we recommend that you first construct
the PypeIt Reduction File you would use to fully reduce the data (see
pypeit_setup) and supply that as the argument to pypeit_trace_edges.
The script usage can be displayed by calling the script with the
-h option:
$ pypeit_trace_edges -h
usage: pypeit_trace_edges [-h] [-v VERBOSITY] [--log_file LOG_FILE]
                          [--log_level LOG_LEVEL] (-f PYPEIT_FILE |
                          -t TRACE_FILE) [-g GROUP] [-d [DETECTOR ...]]
                          [-s SPECTROGRAPH] [-b BINNING] [-p REDUX_PATH]
                          [-c CALIB_DIR] [-o] [--debug DEBUG]

Trace slit edges

options:
  -h, --help            show this help message and exit
  -v, --verbosity VERBOSITY
                        Verbosity level, which must be 0, 1, or 2. Level 0
                        includes warning and error messages, level 1 adds
                        informational messages, and level 2 adds debugging
                        messages and the calling sequence. (default: 2)
  --log_file LOG_FILE   Name for the log file. If set to "default", a default
                        name is used. If None, a log file is not produced.
                        (default: default)
  --log_level LOG_LEVEL
                        Verbosity level for the log file. If a log file is
                        produce and this is None, the file log will match the
                        console stream log. (default: None)
  -f, --pypeit_file PYPEIT_FILE
                        PypeIt reduction file (default: None)
  -t, --trace_file TRACE_FILE
                        Image to trace (default: None)
  -g, --group GROUP     If providing a pypeit file, use the trace images for
                        this calibration group. If None, use the first
                        calibration group. (default: None)
  -d, --detector [DETECTOR ...]
                        Detector(s) to process. If more than one, the list of
                        detectors must be one of the allowed mosaics hard-coded
                        for the selected spectrograph. Using "mosaic" for
                        gemini_gmos, keck_deimos, or keck_lris will use the
                        default mosaic. (default: None)
  -s, --spectrograph SPECTROGRAPH
                        A valid spectrograph identifier, which is only used if
                        providing files directly: aat_uhrf, apf_levy, bok_bc,
                        gemini_flamingos1, gemini_flamingos2,
                        gemini_gmos_north_e2v, gemini_gmos_north_ham,
                        gemini_gmos_north_ham_ns, gemini_gmos_south_ham,
                        gemini_gnirs_echelle, gemini_gnirs_ifu, gtc_maat,
                        gtc_osiris, gtc_osiris_plus, jwst_nircam, jwst_nirspec,
                        keck_deimos, keck_esi, keck_hires, keck_kcrm, keck_kcwi,
                        keck_lris_blue, keck_lris_blue_orig, keck_lris_red,
                        keck_lris_red_mark4, keck_lris_red_orig, keck_mosfire,
                        keck_nires, keck_nirspec_high, keck_nirspec_high_old,
                        keck_nirspec_low, lbt_luci1, lbt_luci2, lbt_mods1b,
                        lbt_mods1b_proc, lbt_mods1r, lbt_mods1r_proc,
                        lbt_mods2b, lbt_mods2b_proc, lbt_mods2r,
                        lbt_mods2r_proc, ldt_deveny, magellan_fire,
                        magellan_fire_long, magellan_mage, mdm_modspec,
                        mdm_osmos_mdm4k, mdm_osmos_r4k, mmt_binospec,
                        mmt_bluechannel, mmt_mmirs, not_alfosc, not_alfosc_vert,
                        ntt_efosc2, p200_dbsp_blue, p200_dbsp_red, p200_ngps_i,
                        p200_ngps_r, p200_tspec, shane_kast_blue,
                        shane_kast_red, shane_kast_red_ret, soar_goodman_blue,
                        soar_goodman_red, subaru_focas, tng_dolores, vlt_fors2,
                        vlt_sinfoni, vlt_xshooter_nir, vlt_xshooter_uvb,
                        vlt_xshooter_vis, wht_isis_blue, wht_isis_red (default:
                        None)
  -b, --binning BINNING
                        Image binning in spectral and spatial directions. Only
                        used if providing files directly; default is 1,1.
                        (default: None)
  -p, --redux_path REDUX_PATH
                        Path to top-level output directory. (default: current
                        working directory)
  -c, --calib_dir CALIB_DIR
                        Name for directory in output path for calibration
                        file(s) relative to the top-level directory. (default:
                        Calibrations)
  -o, --overwrite       Overwrite any existing files/directories (default:
                        False)
  --debug DEBUG         Debug level. (1) Show the result of each stage of the
                        tracing algorithm (previously the --show option). (2)
                        Also show summary plots related to the PCA decomposition
                        and the slit and order matching. (3) Also show the
                        individual polynomial fits to the detected edges.
                        (default: 0)
Specifically note that the --show option will show you the result of the
tracing after each main step in the process. The --debug option provides
additional output that can be used to diagnose the parameterized fits to the
edge traces and the PCA decomposition. Fair warning that, for images with many
slits, these plots can be laborious to wade through…
pypeit_edge_inspector
We also provide a script that allows you to interact with and edit the traces by hand.
Important
Direct, by-hand editing of the edge traces should only be used as a last resort! The automated tracing is deterministic and reproducible, whereas subjective by-eye adjustments to the traces are not. If at all possible, you should use the parameters to fix the performance of the automated tracing. Having said that, there will be cases where the limitations of the automated tracing algorithm(s) affect the quality of data reduction in a way that could be improved by simple by-hand adjustments.
The pypeit_edge_inspector script provides a interactive window (using
matplotlib) that allows you to move, add, and delete traces. The script
requires a valid Edges calibration file and will overwrite this file,
regardless of whether or not you make any adjustments to the traces. For this
reason, we recommend you make a copy of the Edges (and Slits)
calibration file(s) before executing the script.
The script usage can be displayed by calling the script with the
-h option:
$ pypeit_edge_inspector -h
usage: pypeit_edge_inspector [-h] [-v VERBOSITY] [--log_file LOG_FILE]
                             [--log_level LOG_LEVEL] [--try_old]
                             trace_file

Interactively inspect/edit slit edge traces

positional arguments:
  trace_file            PypeIt Edges file [e.g. Edges_A_0_DET01.fits.gz]

options:
  -h, --help            show this help message and exit
  -v, --verbosity VERBOSITY
                        Verbosity level, which must be 0, 1, or 2. Level 0
                        includes warning and error messages, level 1 adds
                        informational messages, and level 2 adds debugging
                        messages and the calling sequence. (default: 2)
  --log_file LOG_FILE   Name for the log file. If set to "default", a default
                        name is used. If None, a log file is not produced.
                        (default: None)
  --log_level LOG_LEVEL
                        Verbosity level for the log file. If a log file is
                        produce and this is None, the file log will match the
                        console stream log. (default: None)
  --try_old             Attempt to load old datamodel versions. A crash may
                        ensue.. (default: False)
The interactive window looks like this:
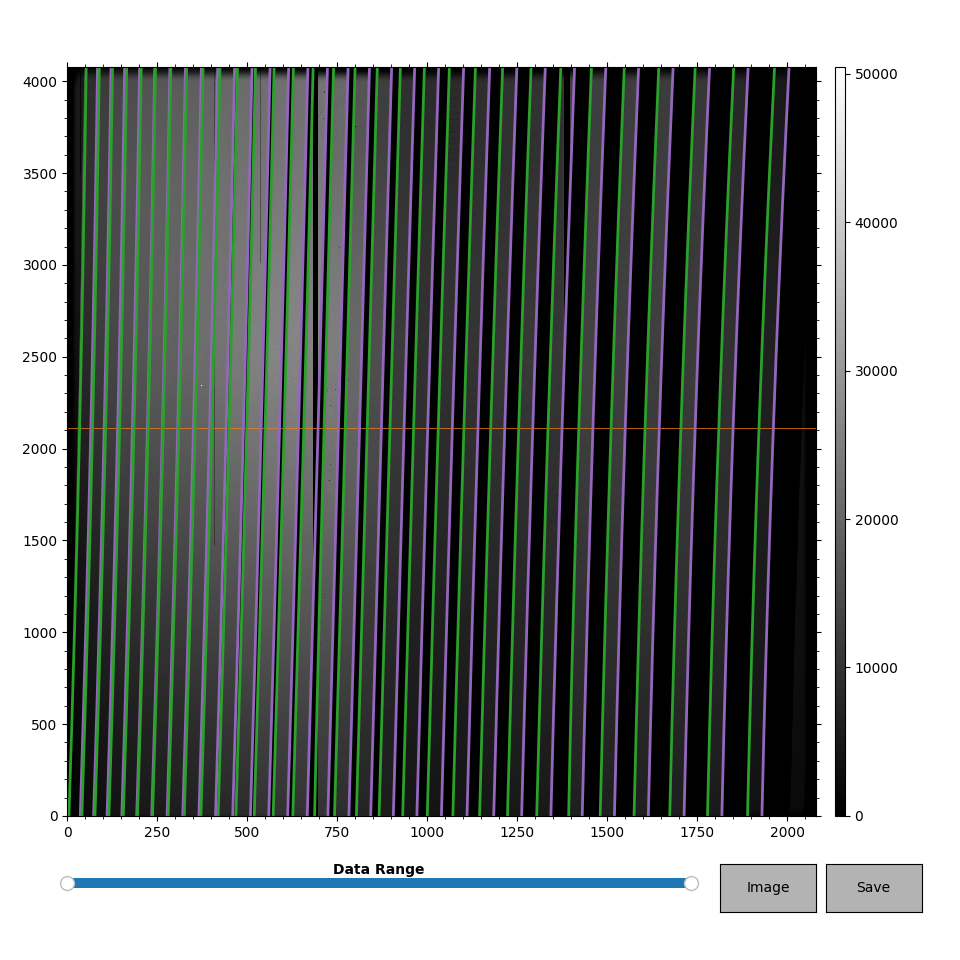
The trace image is shown in grayscale. The left and right traces are green and magenta, respectively. The orange horizontal line shows the “reference row” used when locating new traces. Only the vertical line of the cursor (not shown) moves; the horizontal line always stays at the reference row. Note that the vertical line marking the cursor may not appear if the typical matplotlib zoom or pan buttons are active.
Pressing the ? key anywhere in the window will print the key bindings to the
terminal window:
--------------------------------------------------
Key bindings
    m: Move the nearest trace to the cursor
    d: Delete the nearest trace
    l: Add a left trace
    r: Add a right trace
    U: Undo all changes since last save
    ?: Print this list of key bindings
--------------------------------------------------
The typical matplotlib buttons work as usual. The “Data Range” slider allows
you to change the range of data shown, and appropriately adjusts the colorbar.
The “Image” button at the bottom right allows you to toggle between the trace
image and the sobel-filtered image used to detect the slit edges. The “Save”
button consolidates all the changes you’ve made, saves them to the Edges
object, and attempts to synchronize left-right edges. Make sure you hit the
save button before closing the matplotlib window. Otherwise, any changes you
have made will not be saved. After closing the window, the code overwrites
the Edges and Slits calibration files to include your changes. If you
then re-execute run_pypeit, the code should recognize that the files exist
and use them instead of redoing the edge tracing as long as you don’t tell the
code to do otherwise.
Known Slit Tracing Issues
No Slits
It is possible that the edge-tracing algorithm will not find any slit
edges. This may be because the edges fall off the detector, that there truly
is no data in a given detector of a multi-detector instrument (e.g.,
Keck LRIS), or the threshold for edge detection has been set too high. An
inability to find slit edges can be common for long-slit observations, but
occurs occasionally for multi-slit. If you know that a given detector should
have well-defined slit edges, try adjusting the edge_thresh parameter
(see Detection Threshold). Regardless, if PypeIt does not find any
slit edges, there are two ways it can proceed:
The default behavior for most (but not all) instruments is to simply skip any detectors where the edge-tracing algorithm does not find any edges. If this is the case,
run_pypeitwill issue a warning that the calibrations for a given detector have failed (inget_slits). For single-detector instruments, this means that PypeIt might exit gracefully without actually producing much output. For multi-detector instruments (e.g., DEIMOS), this means that PypeIt will skip any further processing of the detector and move on to the next one. If you already know the detectors that should be skipped, you can use the PypeIt Reduction File to select the detectors that should be processed (see thedetnumparameter in ReduxPar Keywords):[rdx] detnum = 2,3,4You can force PypeIt to add left and right edges that bound the spatial extent of the detector using the
bound_detectorparameter in EdgeTracePar Keywords. This is required for instruments where the entire detector is illuminated so that the slit edges are projected off the detector, or for situations where the detector is windowed (Shane Kast) in such a way that the slit edges are not covered by the windowed detector. Although bounding the detector in this way allows the code to continue to subsequent analysis steps, using this approach comes with a significant warning:Warning
When bounding the spatial extent of the detector by straight slit edges, the spectral curvature is not properly traced. This can lead to errors in the subsequent processing steps and/or highly sub-optimal extraction of any object spectra. If available, users should be sure to add a standard-star observation to the PypeIt file (ensuring that is classified as a
standardframe), so that PypeIt will use the standard star trace as a crutch for object tracing in thescienceframes.
Slit PCA fails
The default tracing uses a PCA analysis that requires a minimum
number of slits to succeed. If there aren’t enough, you should
revert back to the nearest mode by setting the sync_predict
keyword in EdgeTracePar Keywords, e.g.:
[calibrations]
    [[slitedges]]
        sync_predict = nearest
Another option is to set sync_predict = auto. This will let PypeIt
determine which mode to use between pca and nearest. In general,
PypeIt will first try pca, and if that is not possible, it will use nearest.
Missing a Slit
It is common for some spectrographs for the code to miss
one or more slits. This may be mitigated by modifying the
edge_thresh or minimum_slit_length keywords of
EdgeTracePar Keywords.
Otherwise, the code may be instructed to add slits at user-input
locations. The syntax is a list of lists, with
each sub-list having syntax (all integers) detector:y_spec:x_spat0:x_spat1.
For example:
[calibrations]
    [[slitedges]]
        add_slits = 2:2000:2121:2322,3:2000:1201:1500
The above will add one slit on detector 2 with left/right edge at 2121/2322 at row 2000. The shapes of the slit will be taken from the ones that are nearest or the PCA model if it exists.
Too Many Slits
The code may identify stray light or some other spurious
feature as a slit. This might be mitigated by increasing
the value of edge_thresh in
EdgeTracePar Keywords. Indeed, this
is required for longslit observations
with the red camera of Keck LRIS.
Otherwise, the code may be instructed to remove slits at user-input locations. The syntax is a list of lists, with each sub-list having syntax (all integers): detector:y_spec:x_spat For example:
[calibrations]
    [[slitedges]]
        rm_slits = 2:2000:2121,3:2000:1500
This will remove any slit on detector 2 that contains x_spat=2121
at y_spec=2000 and similarly for the slit on det=3.
Slit Tracing Customizing
The following are settings that the user may consider varying to improve the slit tracing.
Remember, you can test the performance of the slit-edge tracing with different parameters using pypeit_trace_edges, instead of executing run_pypeit.
Detection Threshold
The detection threshold for identifying slits is set
relatively low to err on the side of finding more as opposed to fewer slit edges.
The algorithm can be fooled by scattered light and detector
defects. One can increase the threshold with the edge_thresh
parameter:
[calibrations]
    [[slitedges]]
        edge_thresh = 30.
Then monitor the number of slits detected by the algorithm.
Presently, we recommend that you err on the conservative
side regarding thresholds, i.e. higher values of edge_thresh,
unless you have especially faint trace flat frames.
On the flip side, if slit defects (common) are being
mistaken as slit edges then increase edge_thresh
and hope for the best.
Trace Length Threshold
When tracing, edges are found first independently, and then edge pixels are
connected by following the detected edges along the spectral direction. Only
traces that span a specified fraction of the spectral length of the detector are
included in the set of “valid” traces to be fit with a low-order polynomial.
The specified fraction is set by the parameter fit_min_spec_length.
The default value is 0.6, which may be too large for some instruments (e.g. LRISb with the 300 grism). Consider lowering the value, especially if the code raised a warning on too few edges for the PCA decomposition of the traces:
[calibrations]
    [[slitedges]]
        fit_min_spec_length = 0.45
You may also need to adjust the Smash Range.
Smash Range
One of the final steps in slit/order definition is to identify edges by smashing a rectified version of the Sobolev image. The default is to smash the entire image, but if the spectra are primarily in a subset of the image one should consider modifying the default parameter. This is frequently the case for low-dispersion data, e.g. LRISb 300 grism spectra (which has a different default value). Modify it as such:
[calibrations]
    [[slitedges]]
        smash_range = 0.5,1.
Algorithm
See documentation for auto_trace() and the
subfunctions referenced therein.
Open Issues
Bad columns yield fake edges. These should be masked out by the pipeline using the instrument-specific bad pixel mask.
Overlapping slits are notoriously difficult to detect. One may need to add/subtract individual slits on occasion.