PypeIt QA
As part of the standard reduction, PypeIt generates a series of Quality Assurance (QA) files. This document describes the typical outputs, in the typical order that they appear.
The basic arrangement is that individual PNG files are created and then a set of HTML files are generated to organize viewing of the PNGs.
HTML
When the code completes (or crashes out), a set of
HTML files are generated in the QA/ folder. There
is one HTML file per calibration frame set and one
HTML file per science exposure. Example names are
MF_A.html.
Open in your browser and have at ‘em. Quick links are provided to allow one to jump between the various files.
Calibration QA
The first QA PNG files generated are related to calibration processing. There is a unique one generated for each setup and detector and (possibly) calibration set.
Generally, the title describes the type of QA and the sub-title indicates the user who ran PypeIt and the date of the processing.
Wavelength Fit QA
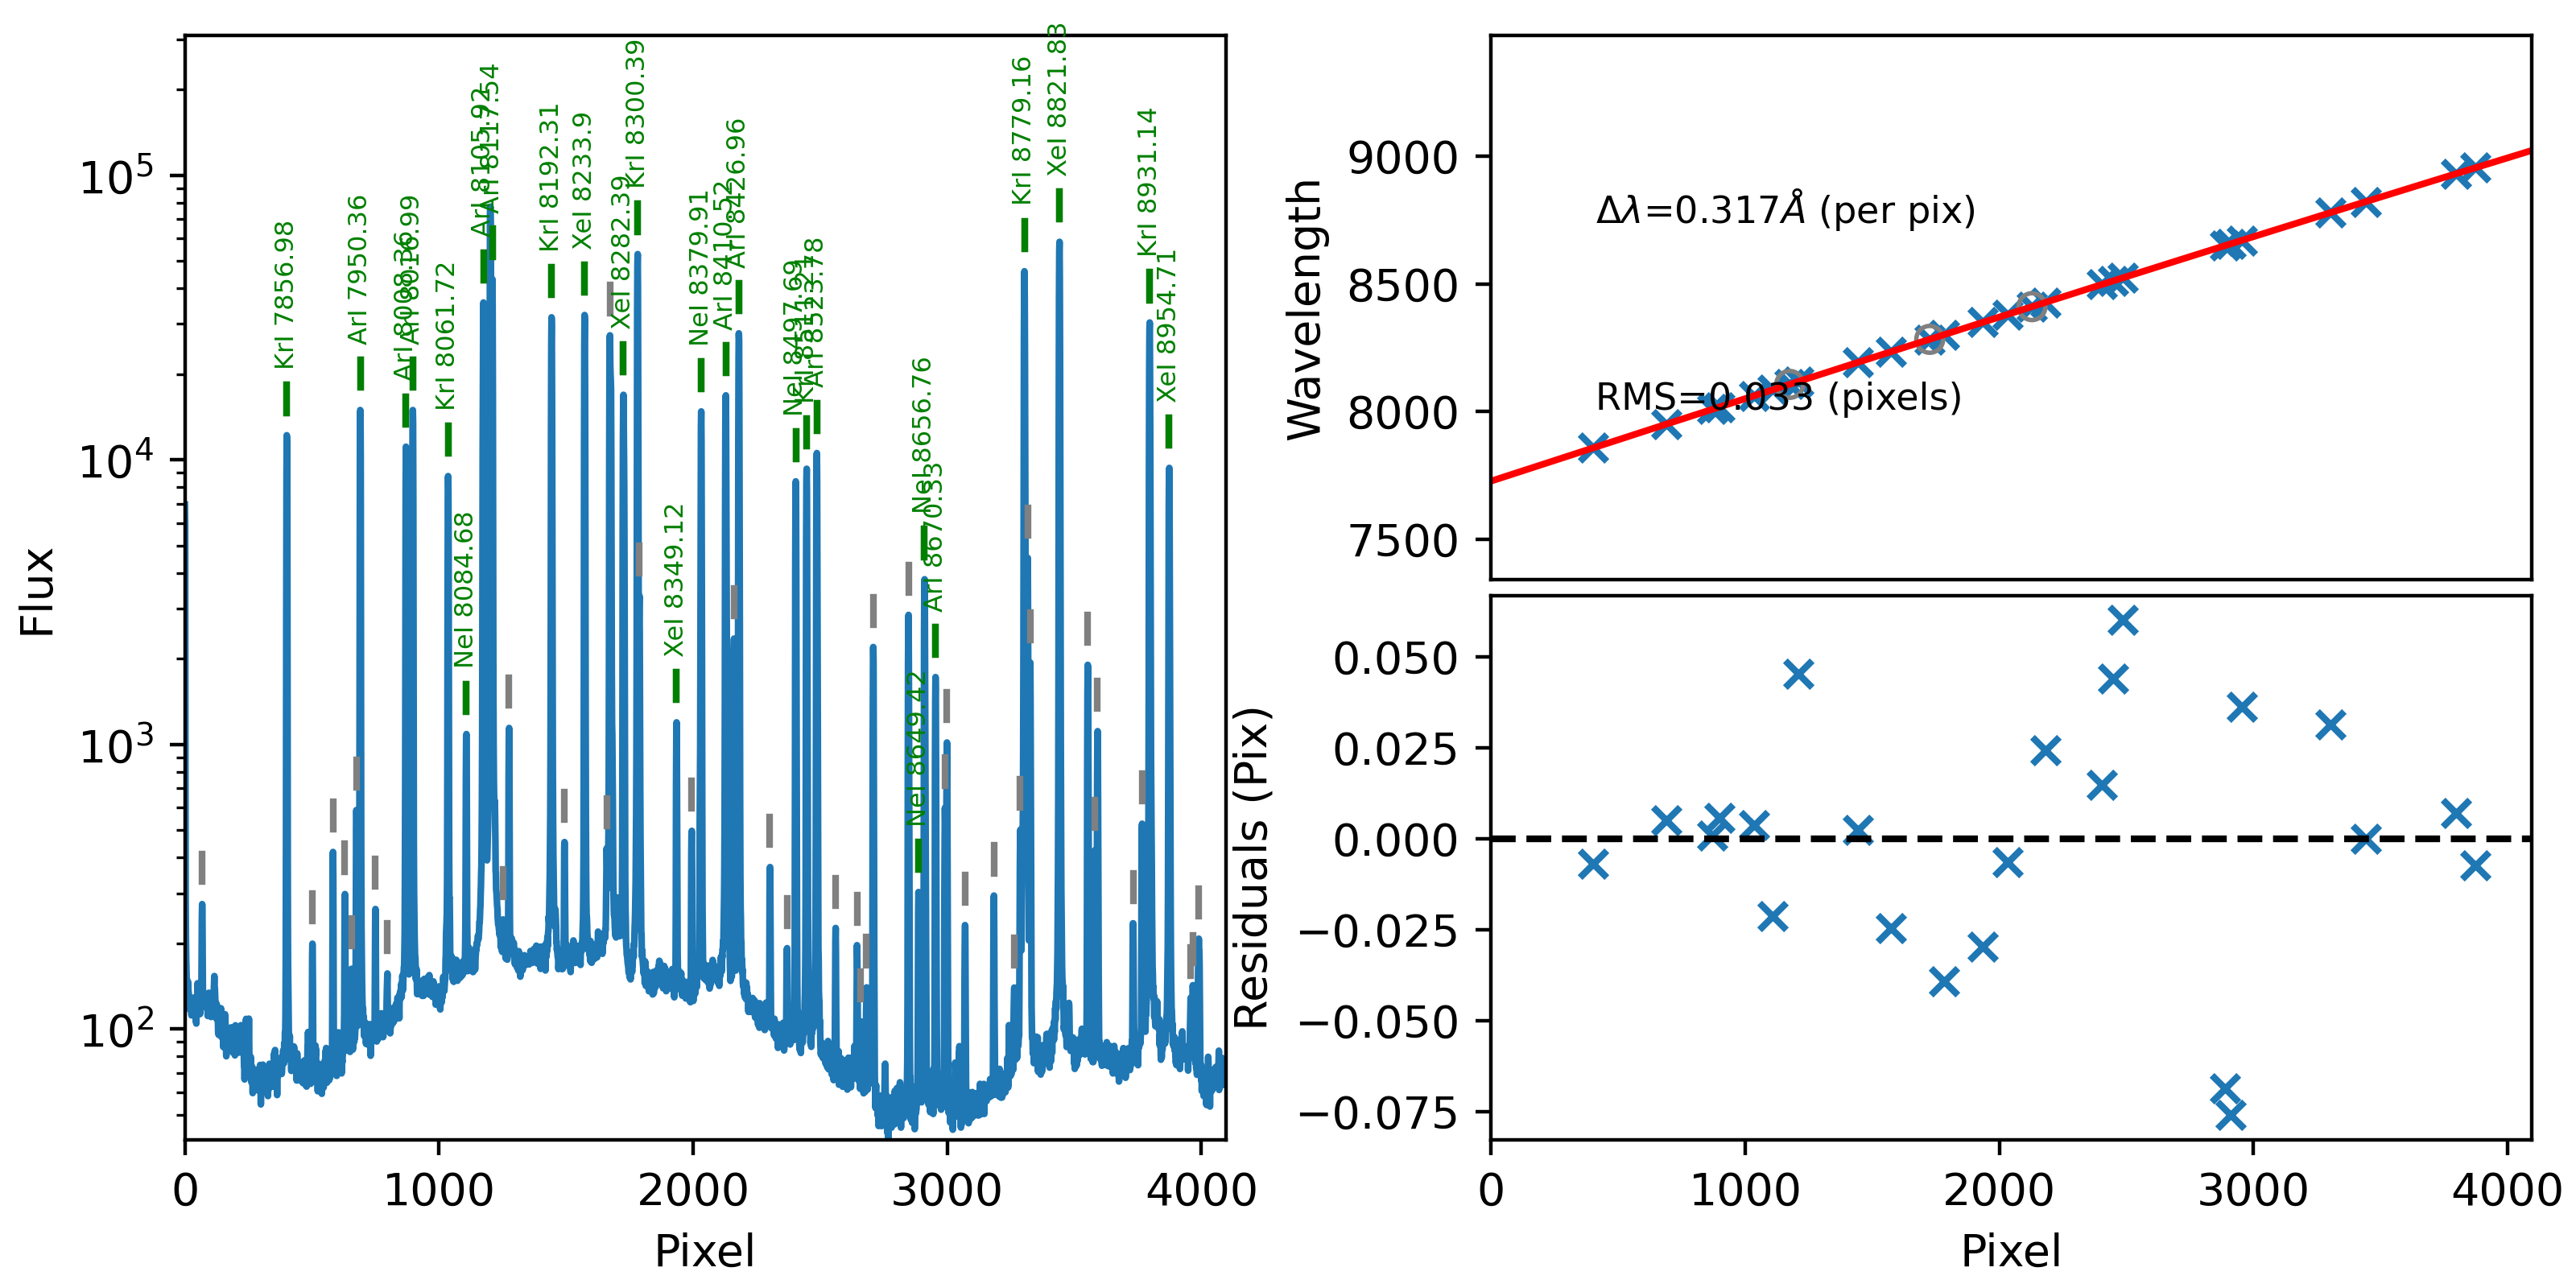
PypeIt produces plots like the one below showing the result of the wavelength calibration.

An example QA plot for Keck/DEIMOS wavelength calibration. The extracted arc spectrum is shown to the left with arc lines used for the wavelength solution marked in green. The upper-right plot shows the best-fit calibration between pixel number and wavelength, and the bottom-right plot shows the residuals as a function of pixel number.
See WaveCalib for more discussion of this QA.
Wavelength Tilts QA
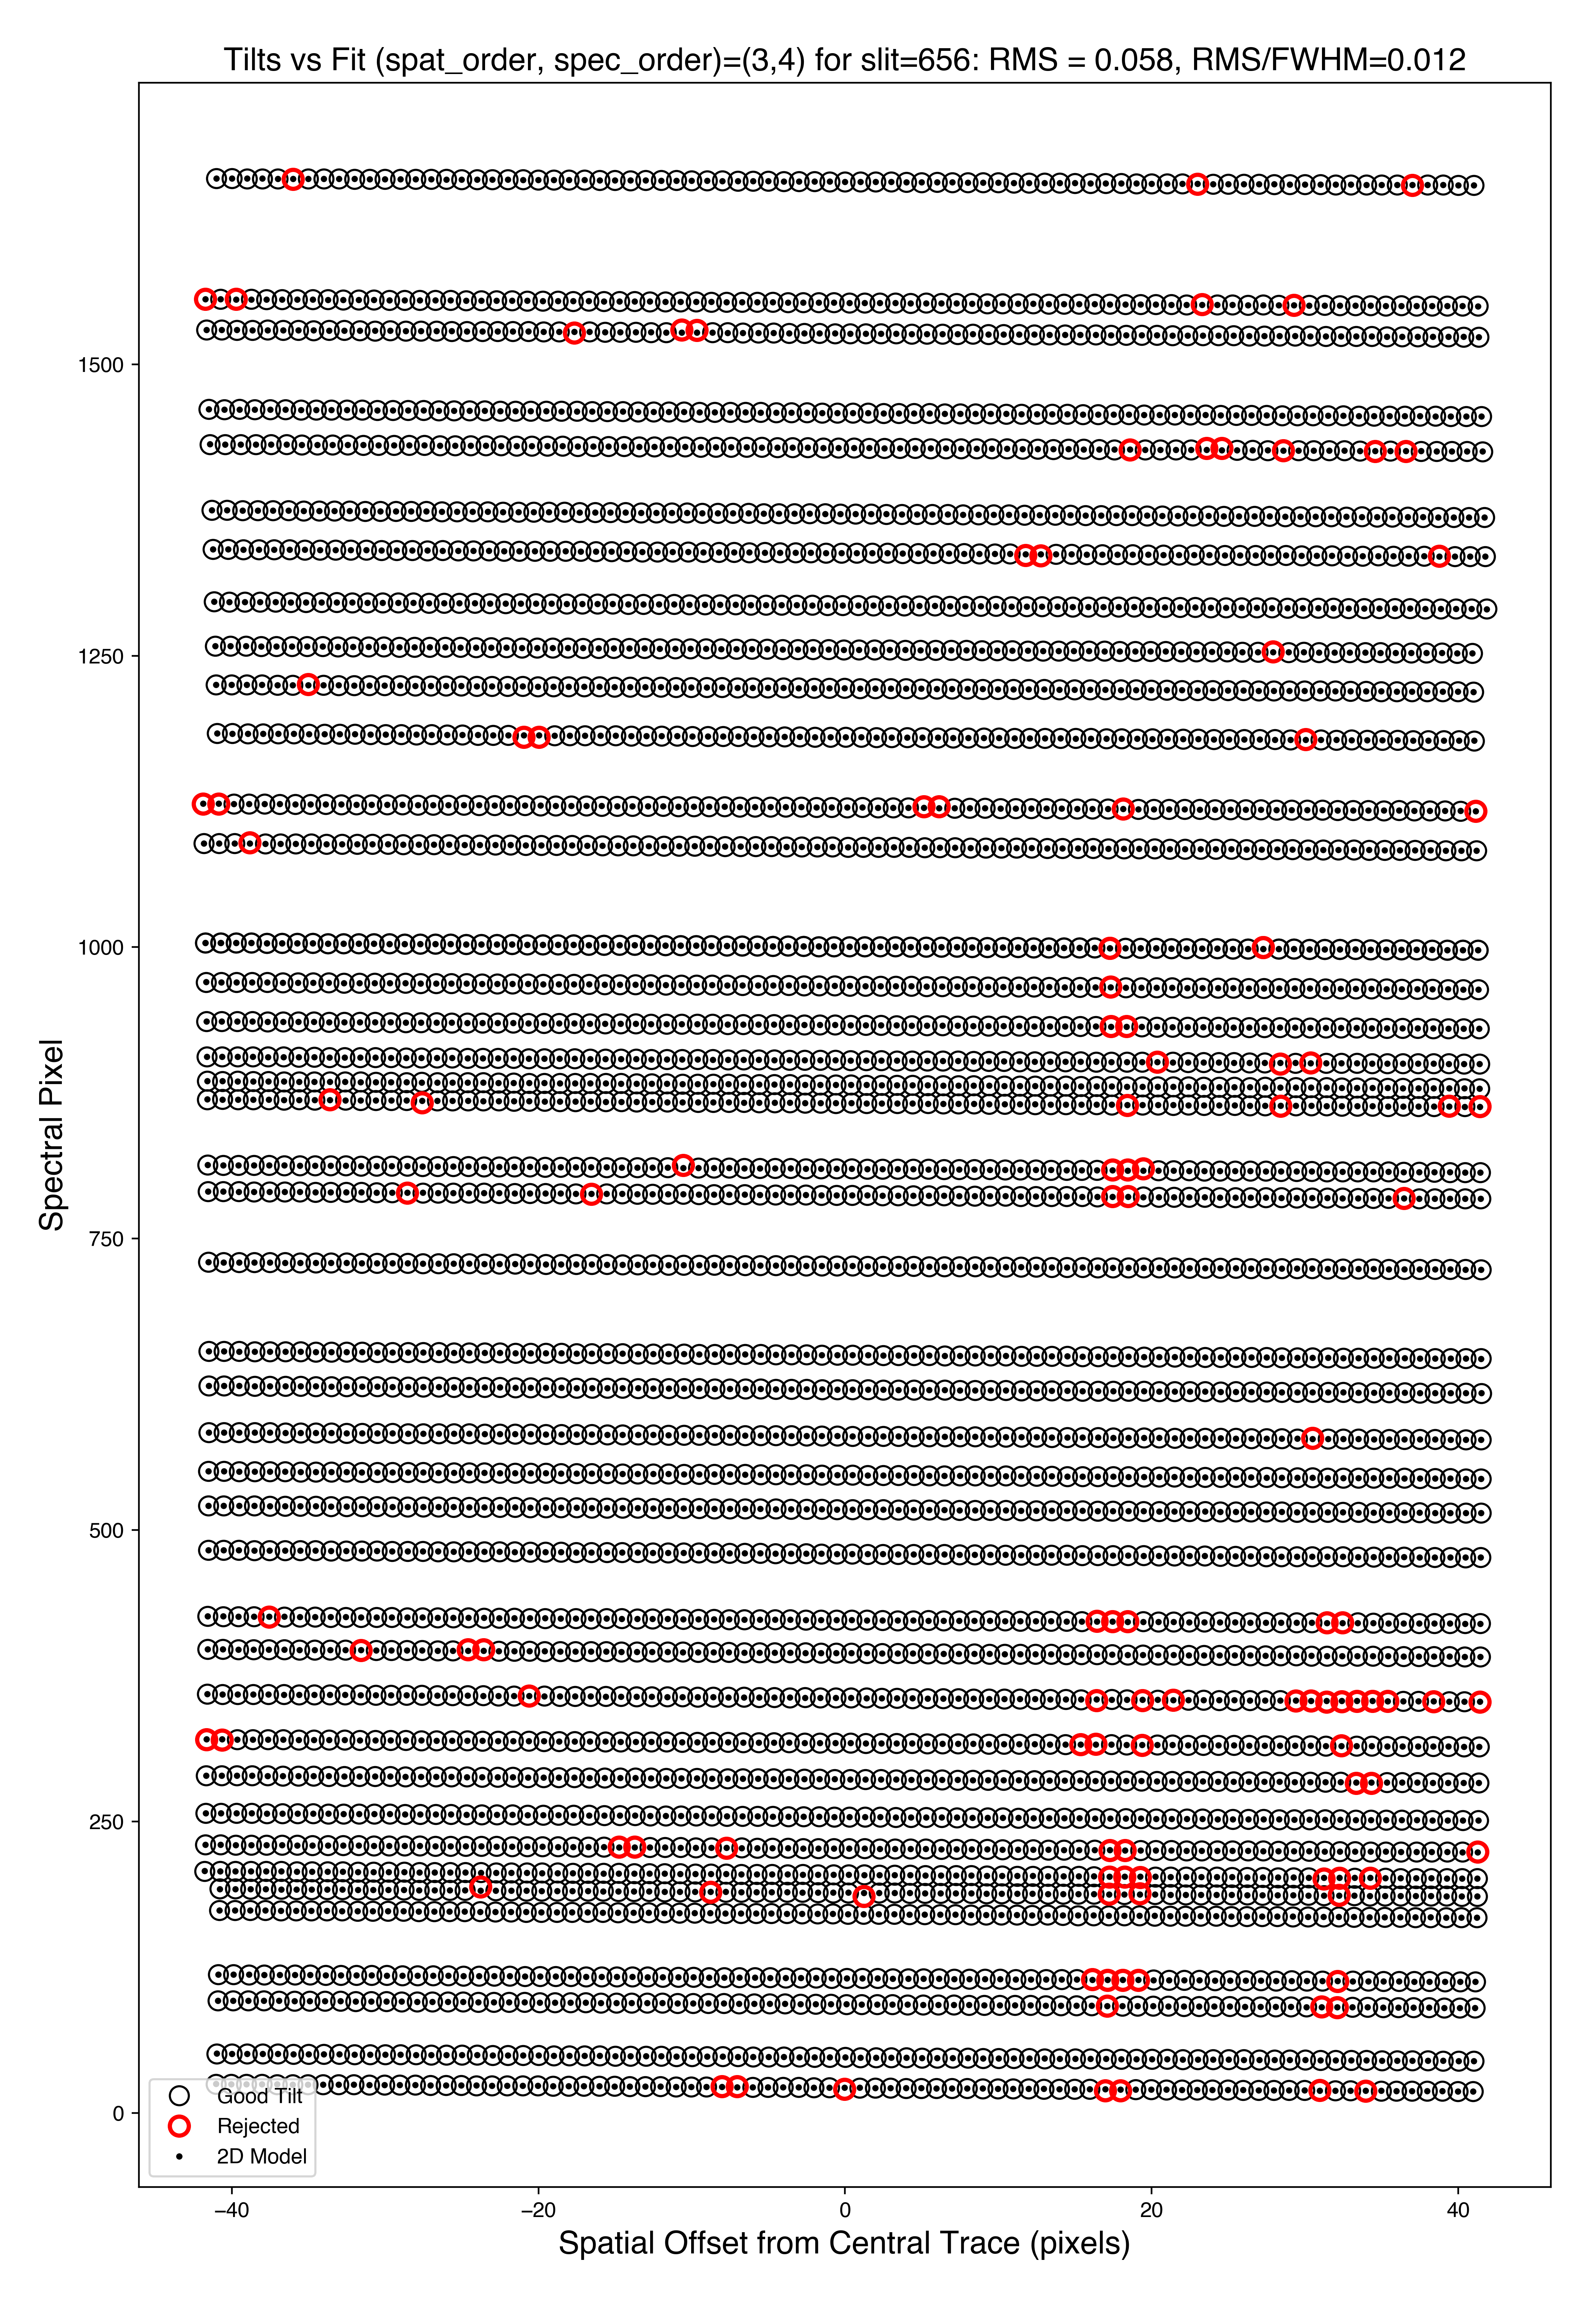
PypeIt produces plots like the one below showing the result of tracing the tilts in the wavelength as a function of spatial position within the slits.

An example QA plot for a single slit in a Keck/MOSFIRE tilt QA plot. Each horizontal line of black dots is an OH line. Red points were rejected in the 2D fitting. Provided most were not rejected, the fit should be good.
See Tilts for more discussion of this QA.
Exposure QA
For each processed, science exposure there are a series of PNGs generated, per detector and (sometimes) per slit.
Flexure QA
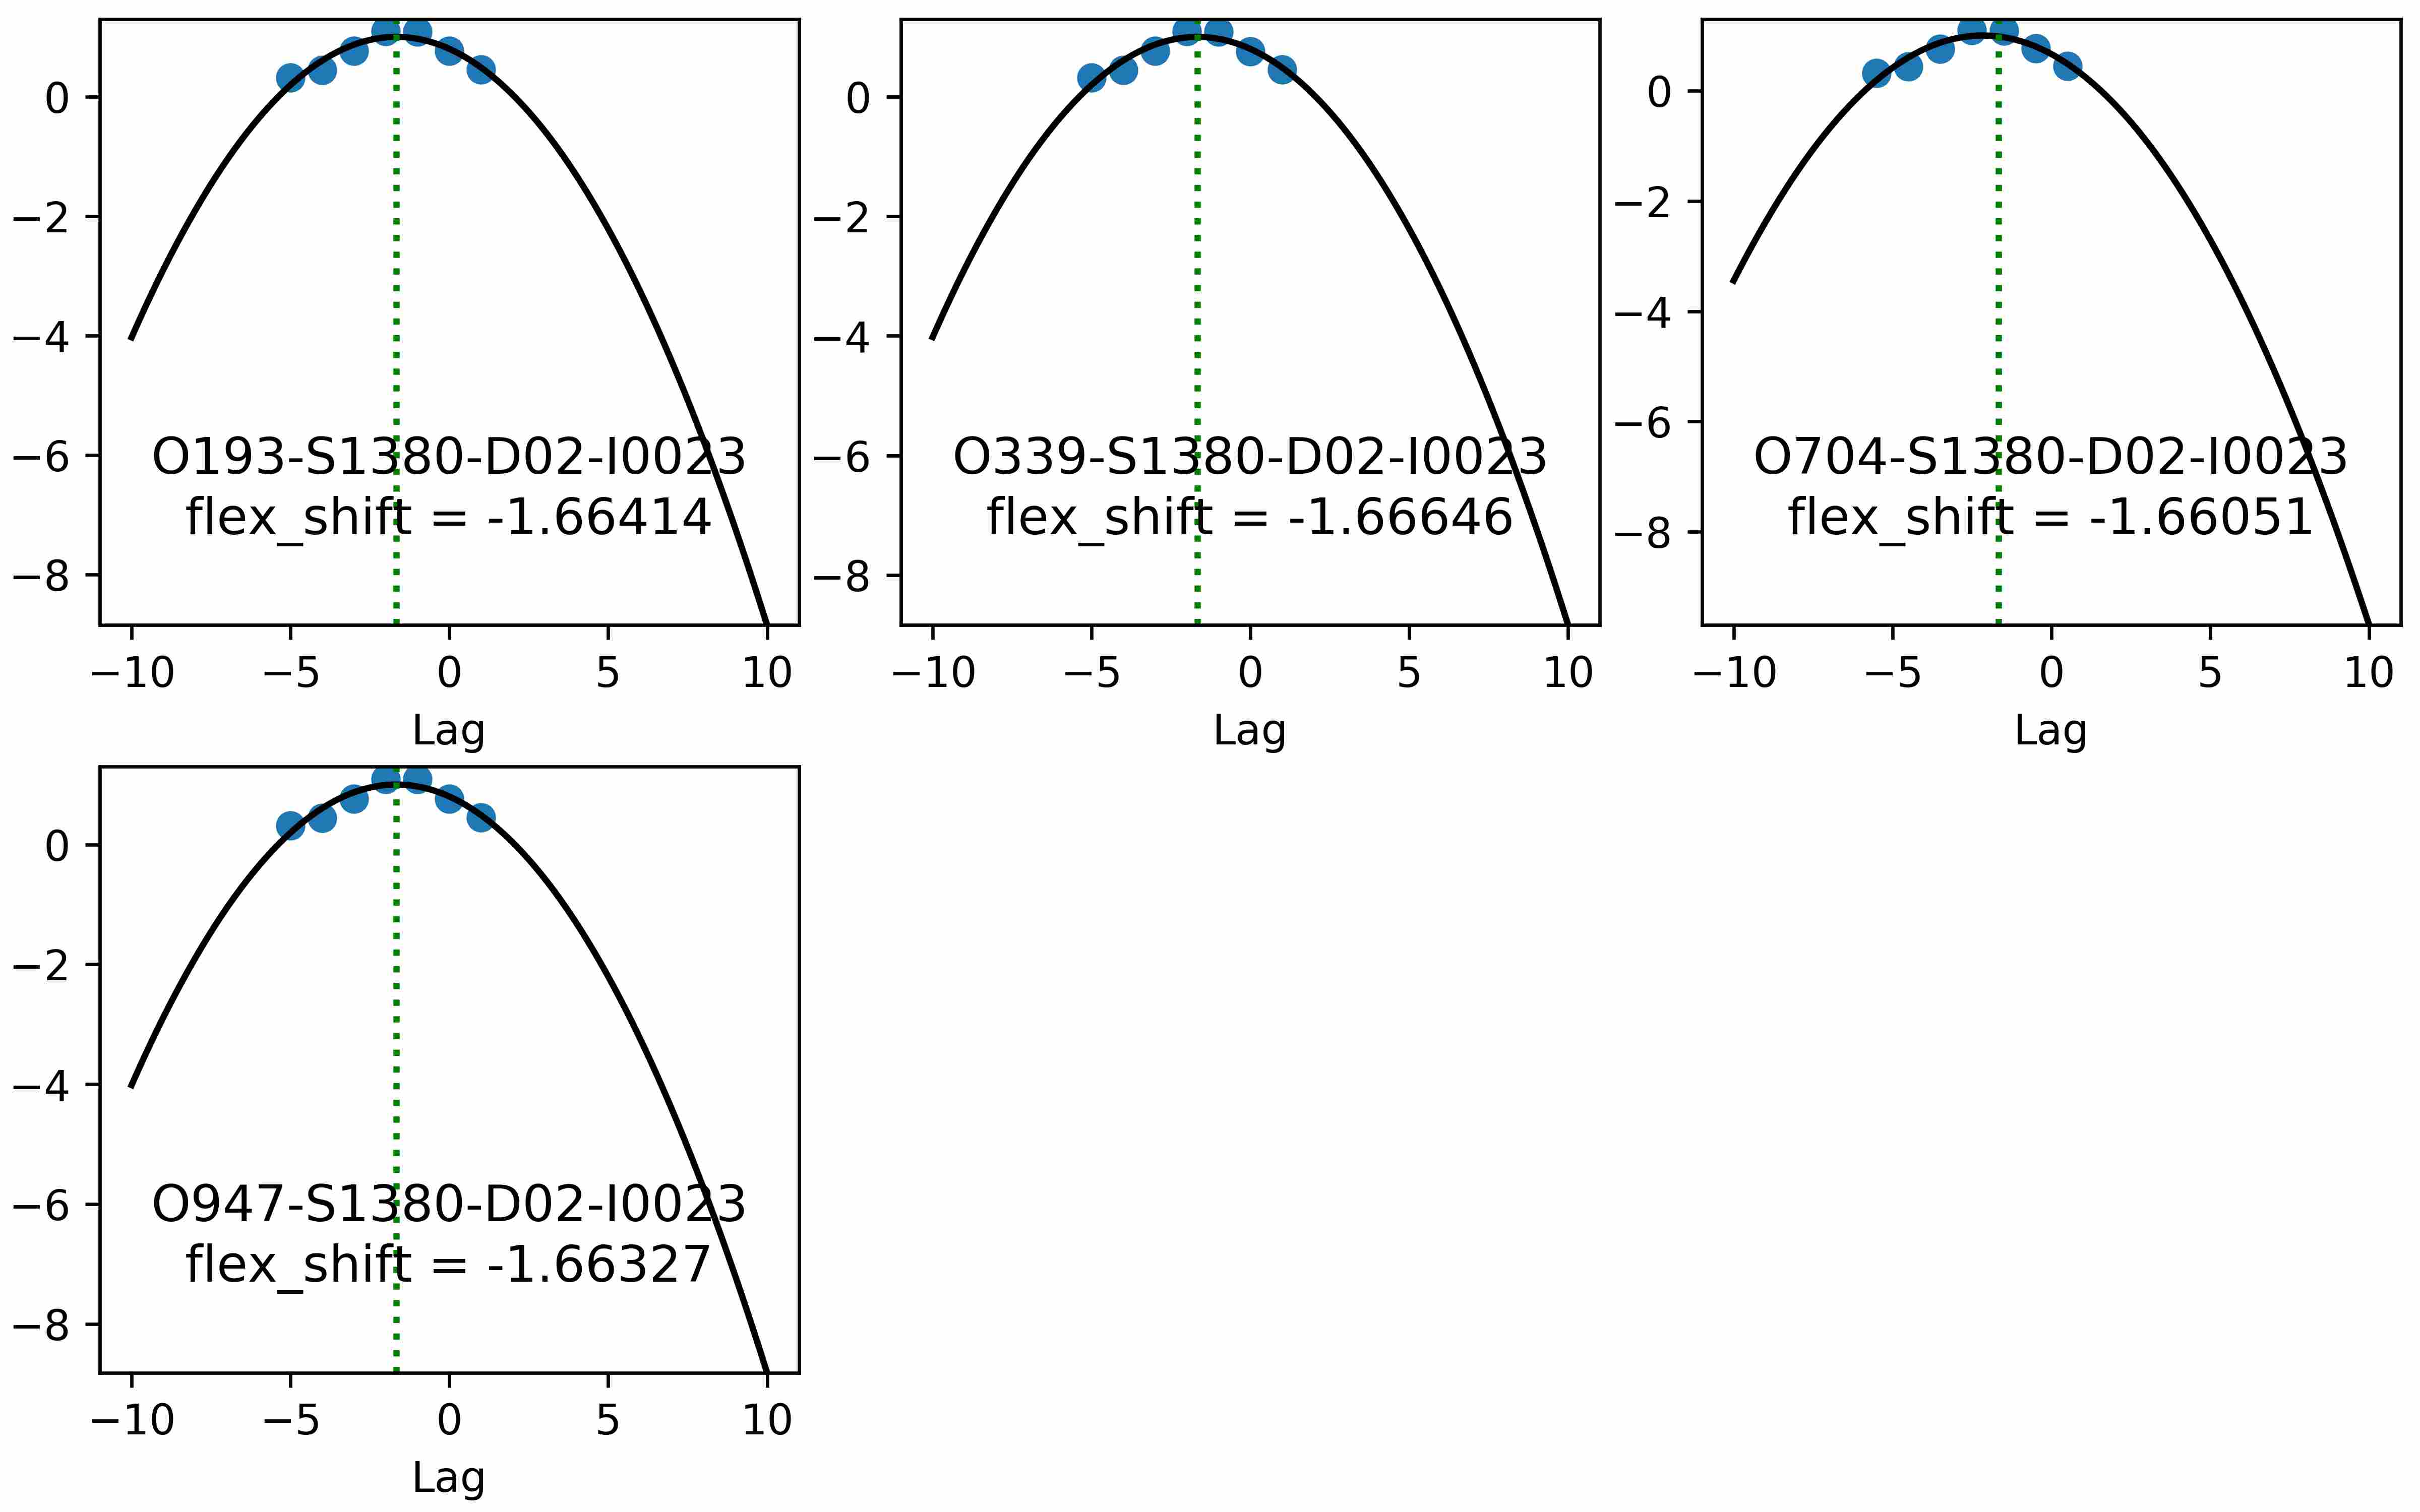
If a flexure correction was performed (default), the fit to the correlation lags per object is shown and the adopted shift is listed. Here is an example:

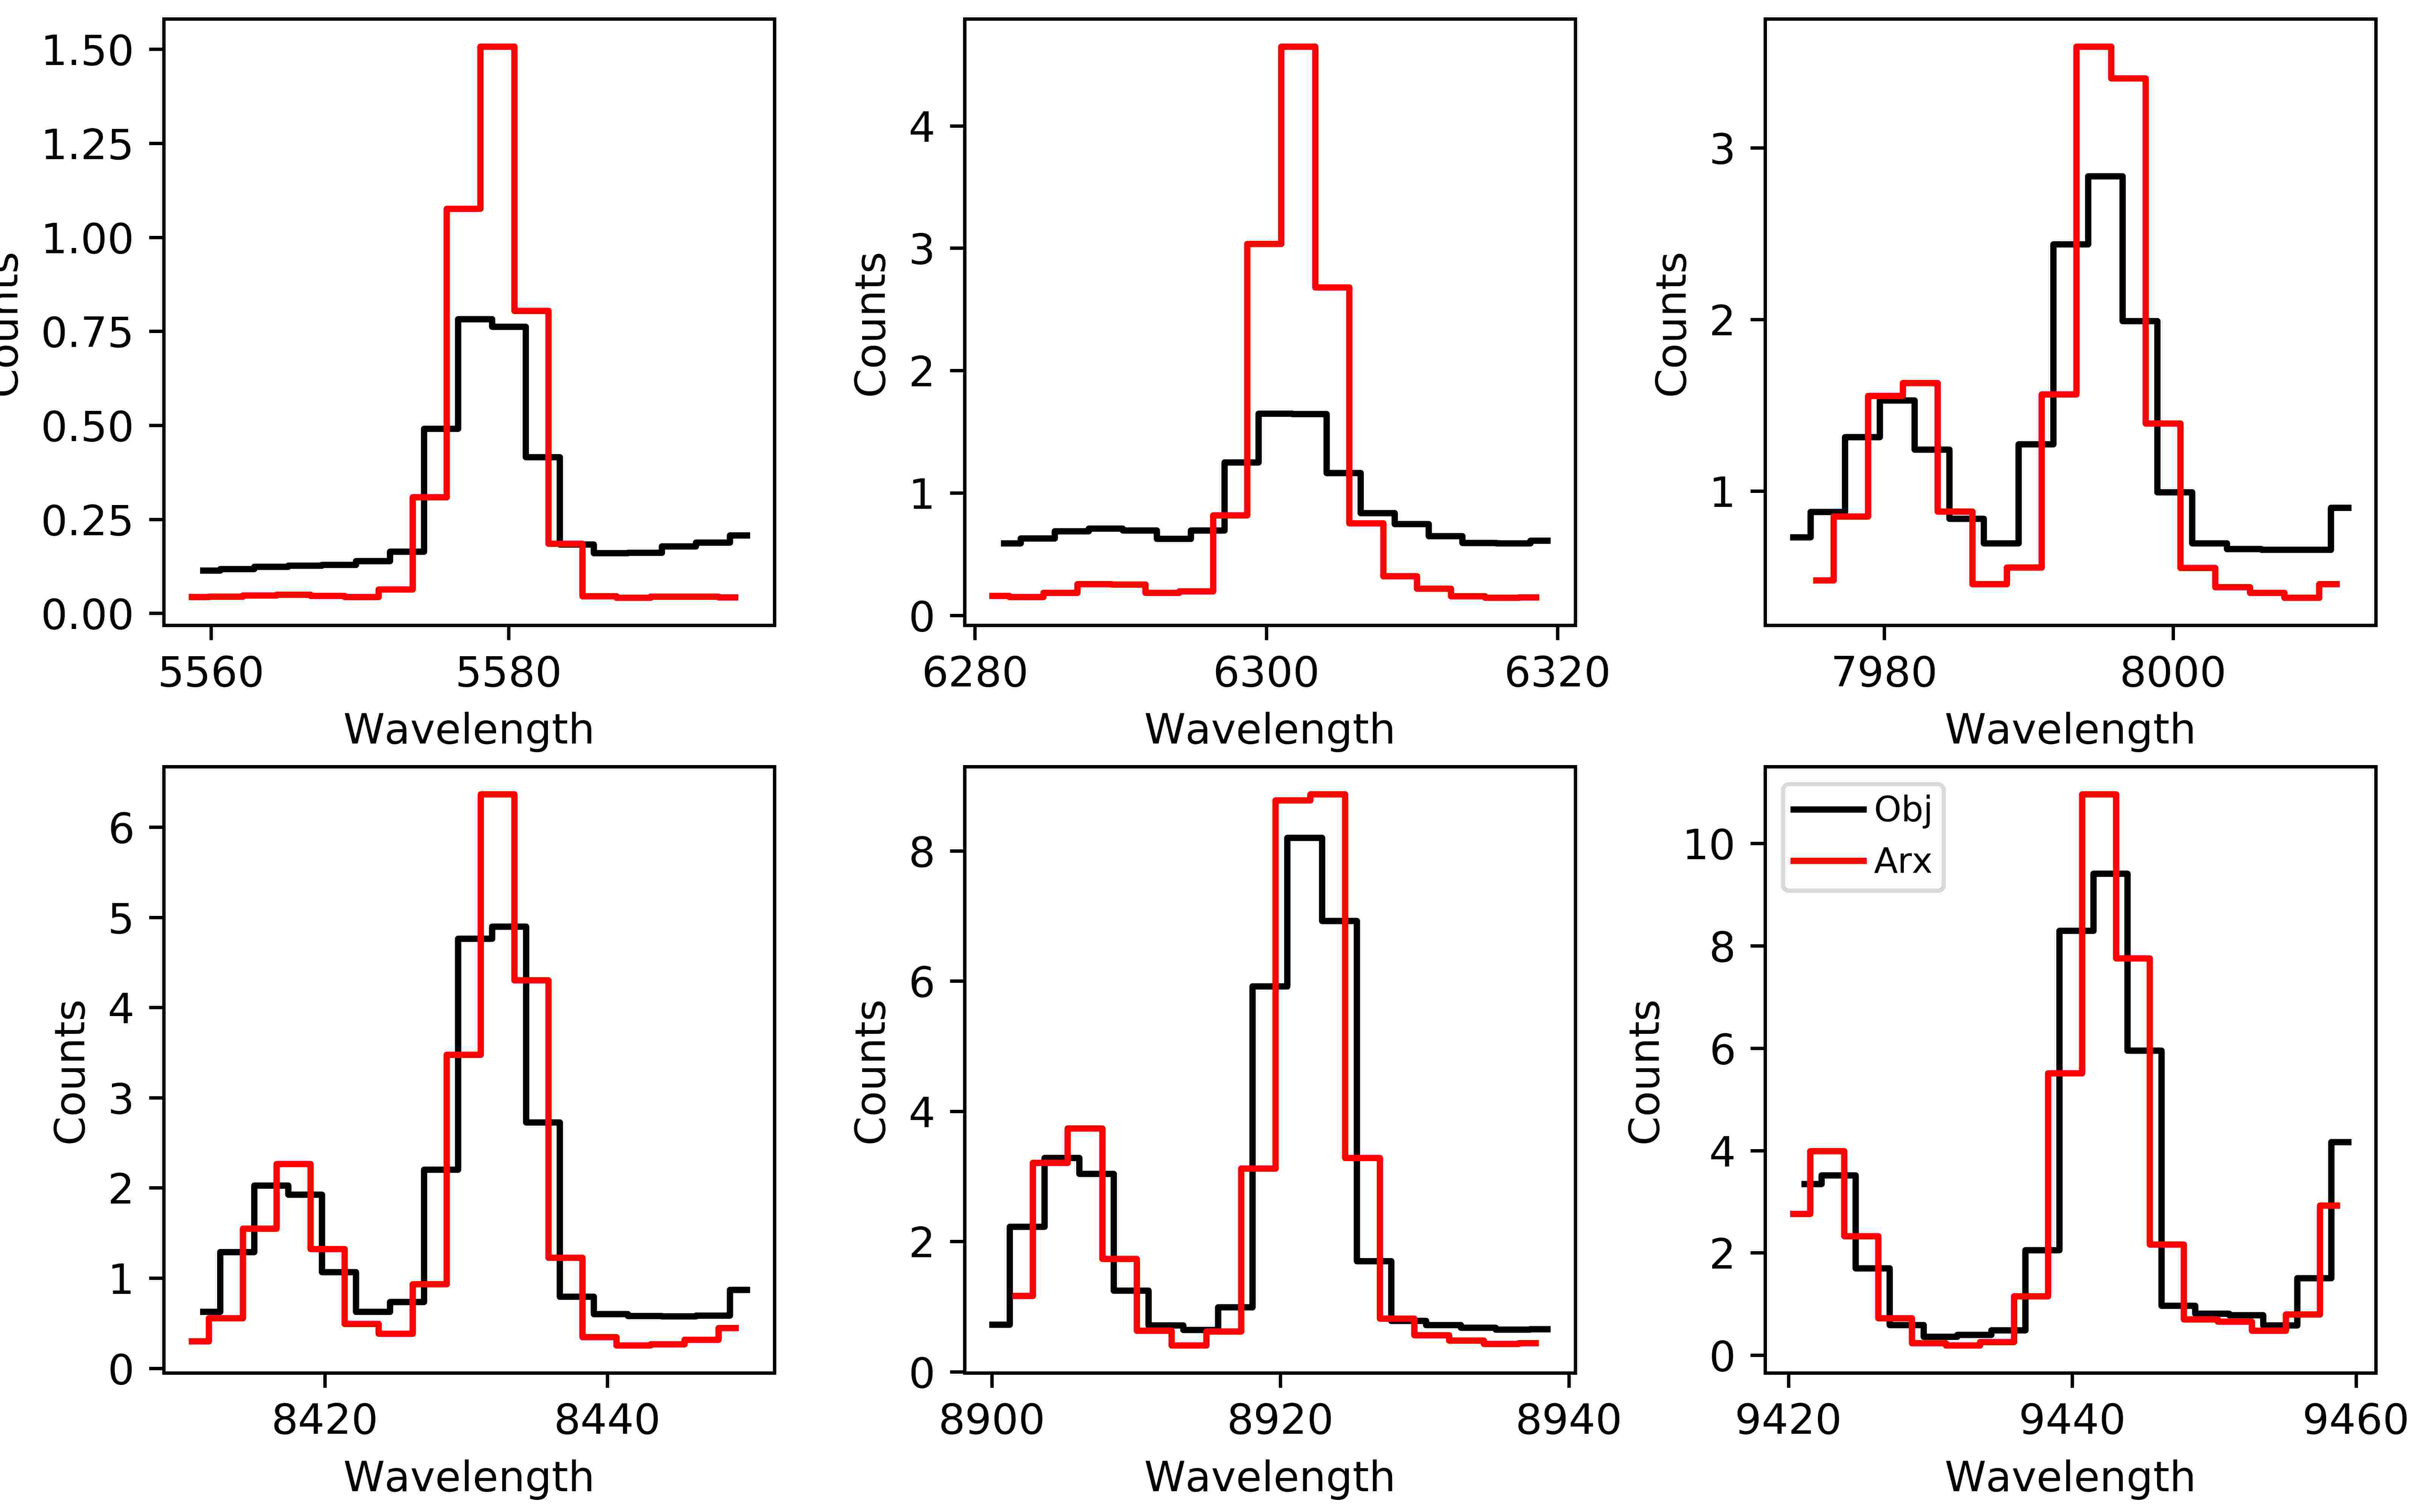
There is then a plot showing several sky lines for the analysis of a single object (brightest) from the data compared against an archived sky spectrum. These should coincide well in wavelength. Here is an example:
