PypeIt Dashboard
Dashboard documentation version: 1.4.0
Warning
Because the Dashboard intentionally lets you run individual steps of the pipeline, users who are not yet familiar with PypeIt — and with data reduction in general — can easily get lost or run steps in an improper order. This is largely why PypeIt is designed to run end-to-end. Please keep this in mind, and try not to report what is in fact user error (running steps out of order, or without their prerequisite calibrations) as a Dashboard bug.
Overview
The PypeIt Dashboard is a desktop graphical application that gives a single, coherent place to monitor and inspect a PypeIt data reduction. A typical reduction produces a scattered collection of calibration files, 2D/1D spectra, and fixed-format QA figures, and its progress is not surfaced in any one place. The dashboard makes that workflow legible and navigable: it shows, at a glance, where a reduction stands, what it has produced, and where it may have gone wrong, and it puts the existing inspection tools one click away.
The dashboard concentrates on the core run of PypeIt — the reduction and the
inspection / QA of its calibrations. It reads the reduction state that
run_pypeit records on disk (see PypeIt Reduction State) and reuses the existing
PypeIt inspection scripts (pypeit_chk_* / pypeit_view_fits / ginga)
rather than reimplementing any plotting.
Note
The dashboard is built on PyQt6 (via qtpy), the same GUI stack as the
PypeIt setup GUI. It launches the inspection tools as subprocesses, so no
extra plotting dependencies are required.
Launching
The dashboard is launched like any other PypeIt command-line script, from within
a reduction (configuration) folder — the per-configuration directory created by
pypeit_setup that contains the .pypeit file. The .pypeit file is
a required argument:
pypeit_dashboard shane_kast_blue_A.pypeit
Useful options:
--redux_path— the reduction directory (defaults to the directory containing the.pypeitfile).standard PypeIt logging options (
-v,--log_file).
On startup the dashboard derives the reduction state: if a
<root>_state.json file is present (written by run_pypeit /
pypeit_run_to_calibstep; see PypeIt Reduction State) it is loaded; otherwise the
state is computed the way pypeit_status does (a read — no processing is
performed and no state file is written). Computing the state may briefly block
the UI on launch.
The Status view
The Status tab is the landing, state-first view: it answers “where does this reduction stand?” at a glance.
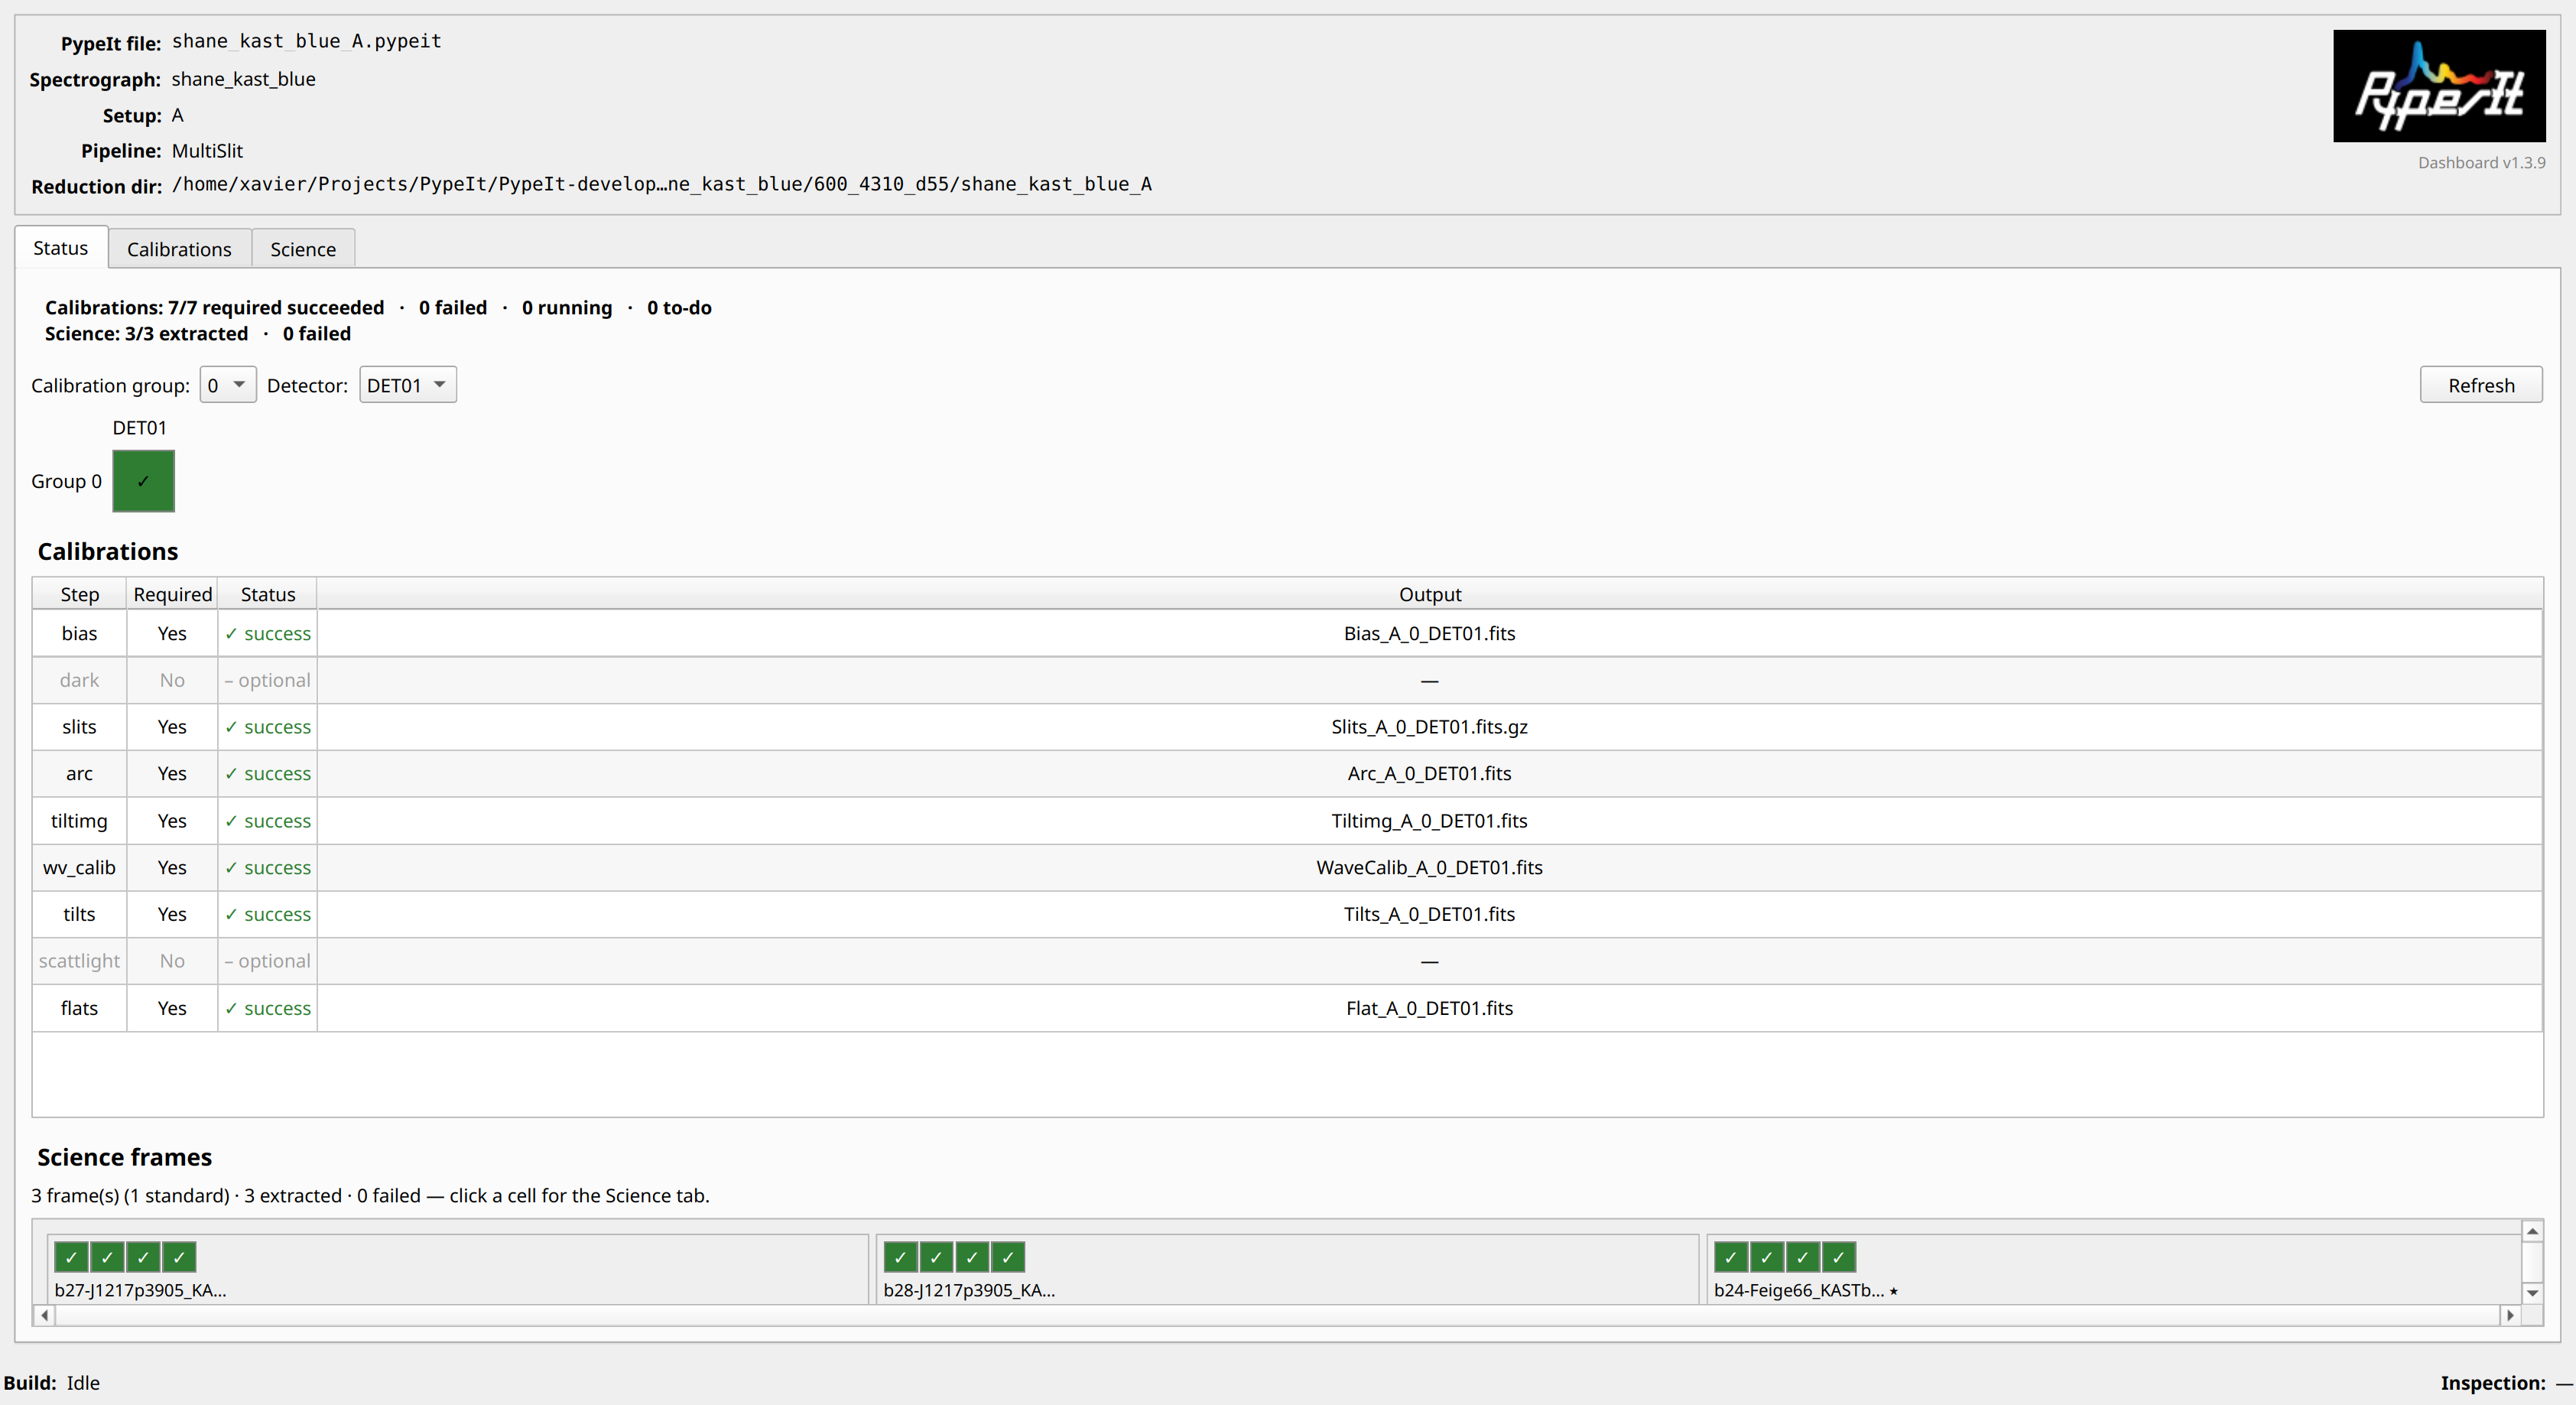
The Status view for a Shane Kast blue reduction: the global summary strip, the scope drop-downs and Refresh, the configuration-overview navigator, and the color-coded calibration table.
Top to bottom it shows:
Global summary strip — whole-run health, e.g. “Calibrations: 6/6 required succeeded” plus counts of failed / running / to-do.
Scope toolbar — calibration-group and detector/mosaic drop-downs that scope the table to one
(group, detector); a Refresh button that re-reads (or re-derives) the state; and a stale badge if the state file is older than the.pypeitfile or the calibration outputs.Configuration-overview navigator — a compact
(group × detector)grid, each cell colored by the worst step status in that cell (fail > running > to-do > success). Clicking a cell scopes the table to it (it is a single cell for a single-group/single-detector run, and a heat-map for MOS/mosaic runs).Calibrations table — the scoped step status: Step | Required | Status | Output, with the status palette above and optional steps dimmed.
Science frames — a compact summary (frame/standard counts, how many extracted, how many failed) above a science navigator grid: one clickable cell per
(frame, detector)(science frames first, then standards), each a four-segment strip coloring theprocess/findobj/skysub/extractmacro-steps by the status palette. Clicking a cell switches to the Science view and selects that frame.
If the reduction has not started, or the state file is missing or unreadable, the view shows a clear message instead of an empty grid.
The Calibrations view
The Calibrations tab is the drill-down: it shows the detailed status of the
calibrations for one (calibration group, detector/mosaic) at a time and
lets the user inspect each calibration.
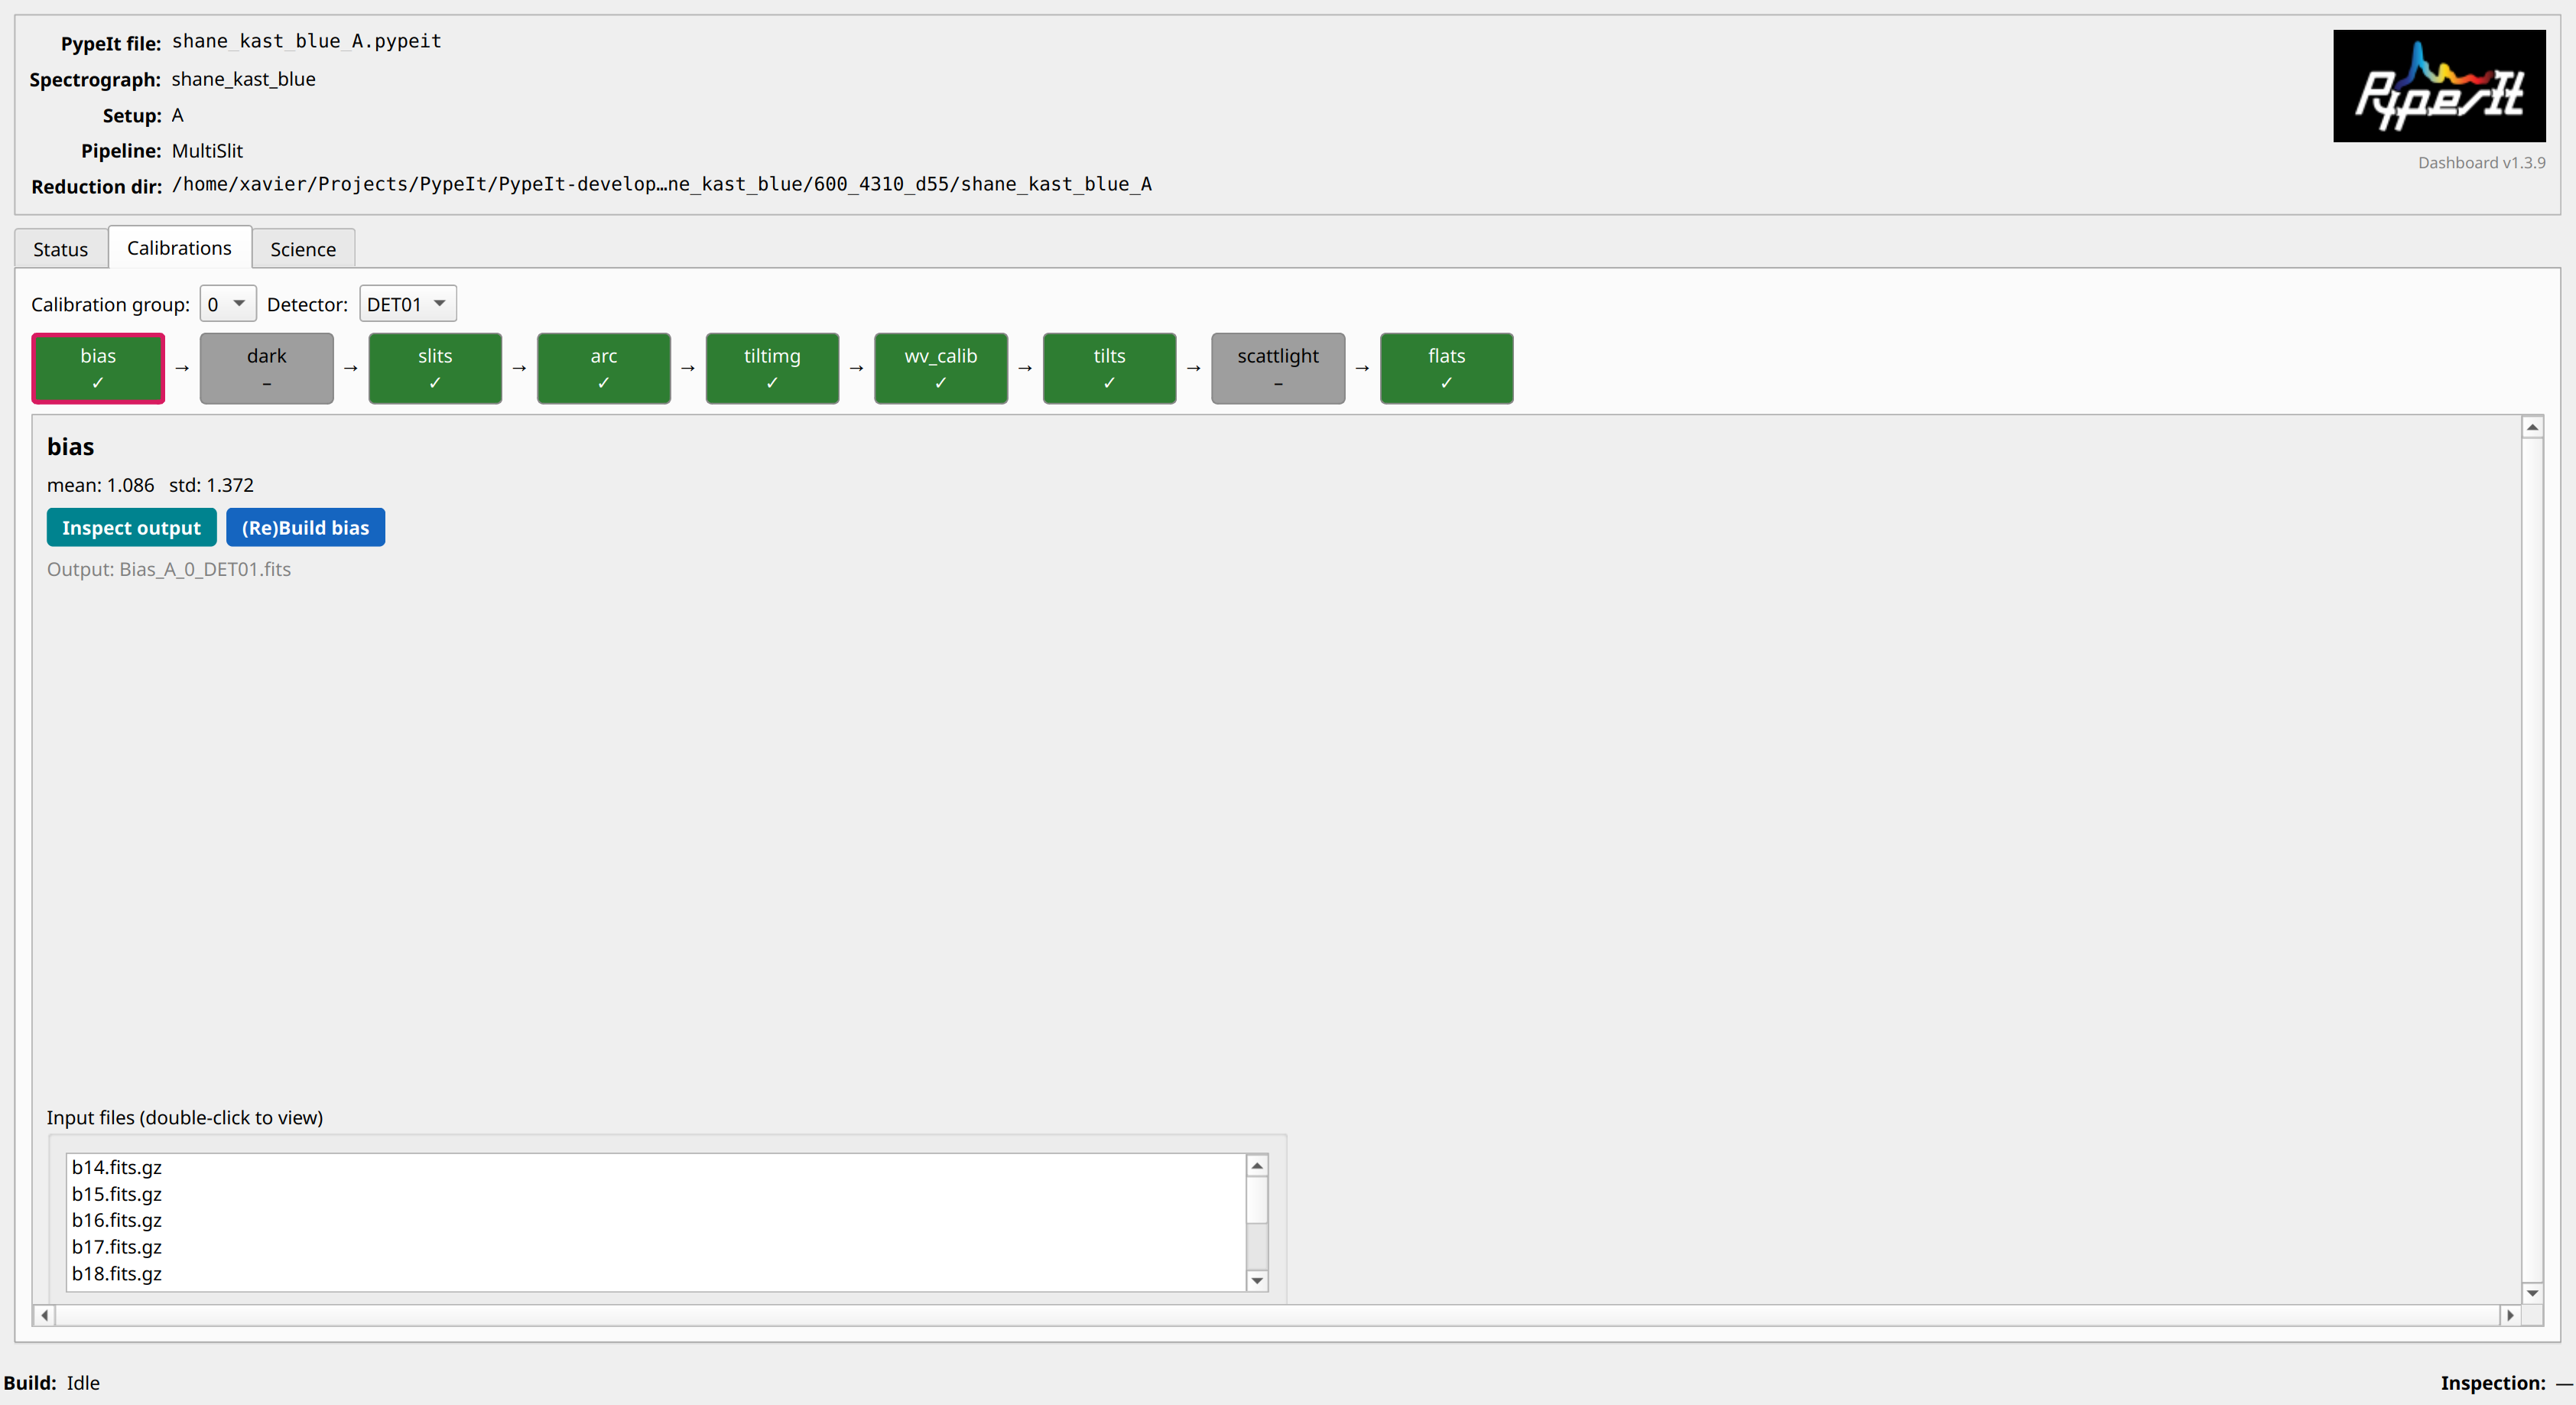
The Calibrations view with flats selected: the path-aware step-button
row (selected step ringed in magenta), the detail panel with the “Inspect
output” and blue (Re)Build actions, the per-slit/order table (here with
per-correction columns and a skipped slit), and the grouped input-file list.
It contains:
Scope selectors — the calibration-group and detector/mosaic drop-downs (independent of the Status tab’s).
Step-button row — one button per calibration step, laid out left→right in the spectrograph’s dependency order (MultiSlit/Echelle vs IFU), each colored by the status palette. The internal
bpmstep is omitted (it has no standalone output). Clicking a button selects it; the selected step is ringed in magenta.Detail panel for the selected step:
Metrics — whatever the state records for that step (e.g.
biasmean/std;slitsnslits;flatscorrections and provenance).Inspect output — launches the appropriate viewer for the step’s processed output (see the table below). Enabled only when the output file exists on disk.
(Re)Build — a distinct blue action button (beside “Inspect output”) that regenerates the selected calibration by launching pypeit_run_to_calibstep for it (and any preceding steps it depends on). Before it runs, a confirmation names the output file(s) it will overwrite. While any PypeIt run is in progress the button turns orange and reads “⏳ Run in progress” and cannot be clicked (the lock’s visual cue); when the run finishes the rebuilt step stays selected so you see its new status. See (Re)building a calibration below.
Output filename — the step’s output file is named in the panel (so it is visible even for steps with no viewer, e.g.
wv_calib).QA files — the related QA PNGs; double-click to open one full size.
Per-slit/order table — for
slits/wv_calib/tilts/flats, one row per slit/order with its status and metric. Forflatsthe row carries per-correctionmean/rmscolumns and may be skipped. For an Echelle reduction the rows are per order, and the table and its column are labeled “Order” accordingly.Input files (bottom) — the raw frames used to build the calibration; double-click to view one. For
flatsthey are grouped by role (pixelflat / illum / lamp-off).
Inspection tools
“Inspect output” launches the matching existing PypeIt tool as a subprocess; the status bar reports the launch and where the result appears (e.g. a Ginga window).
Step |
Output |
Viewer |
|---|---|---|
|
processed calibration image |
|
|
|
|
|
|
no separate viewer — see its QA files (the |
|
|
|
|
|
|
|
|
|
|
|
|
Raw input frames are viewed with pypeit_view_fits --proc (processed/oriented
for a proper view). The status bar shows the exact command it runs, in quotes,
so you can reproduce it from the command line. See PypeIt QA and
Command-line Scripts for more on the inspection tools.
(Re)building a calibration
The (Re)Build button (blue, in the detail panel) regenerates the selected calibration without leaving the dashboard. It launches pypeit_run_to_calibstep for the selected step, which rebuilds that step and any preceding steps it depends on, reusing the calibrations already on disk. Two safeguards apply:
Clobber confirmation. Regenerating overwrites the step’s existing output. Before launching, a dialog names the exact file(s) that will be overwritten (for
slitsthis is both theSlits_*andEdges_*files); only the selected step’s output is moved aside — the preceding steps are reused. The move-aside is crash-safe: if the run fails, the original file is restored, so a failed (re)build never loses an existing calibration. Cancelling does nothing.Single-run lock. At most one PypeIt run may be active at a time. While a run is in progress — whether you launched it from the dashboard or started
run_pypeit/pypeit_run_to_calibstepin a terminal (detected by watching the reduction.log) — the (Re)Build control turns orange, reads “⏳ Run in progress”, and is disabled.
The run is reported in the status bar, and when it finishes the dashboard
re-reads the state and re-colors the step buttons and tables to reflect the
new outputs. If the run fails (the reduction errors out and exits with a
non-zero code), the offending step is colored red (fail) rather than
left stuck on orange (running), and the Build channel of the status bar
reports the failure (e.g. “(Re)Build failed (exit code 1) — see the log.”)
instead of returning to Idle.
The Science view
The Science tab shows the reduction status of each science and standard exposure, the counterpart of the Calibrations view for the science frames.
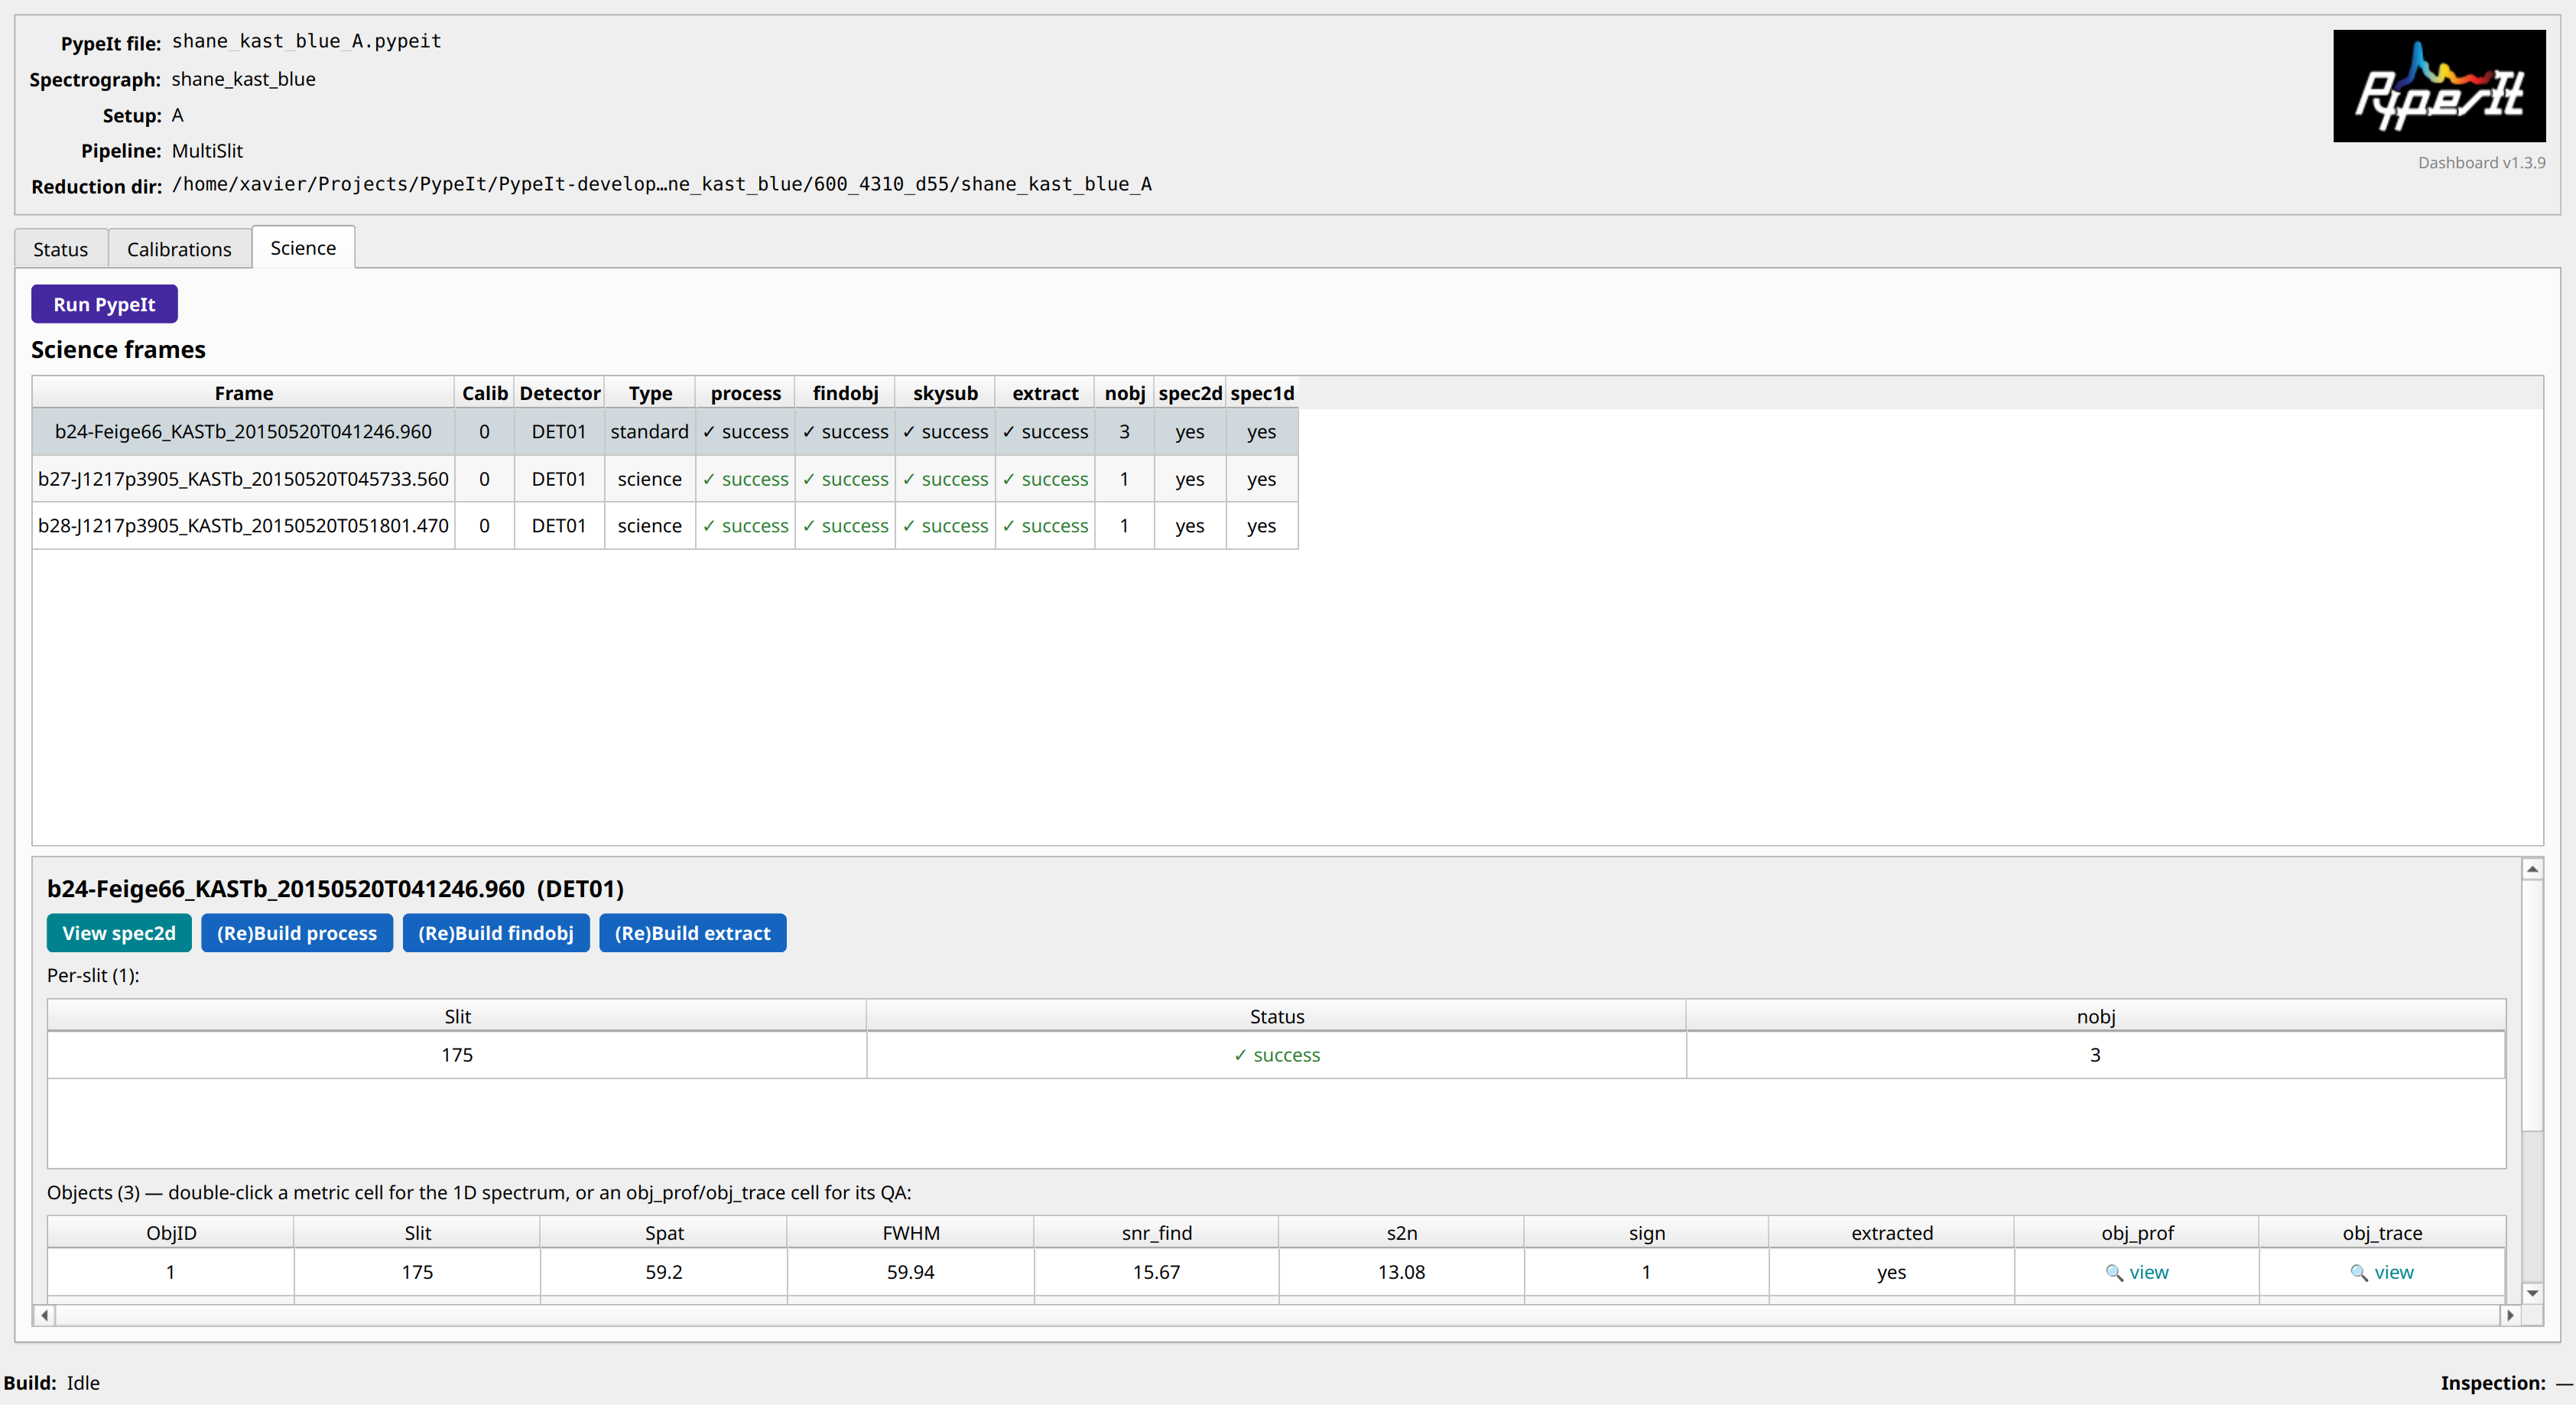
The Science view: the per-frame table (one row per (frame, detector),
with the four reduction-step statuses), and the detail panel for the selected
frame with its per-slit and per-object tables and the (Re)Build controls.
It contains:
Run PypeIt — a view-level button (above the table) that launches the full reduction (
run_pypeit -o): it processes all science and standard frames and overwrites the existing science outputs. It warns before running and is governed by the same single-run lock as the (Re)Build controls (it turns orange “⏳ Run in progress” while a run is active). This is distinct from the per-frame, per-step (Re)Build buttons in the detail panel.Per-frame table — one row per
(frame, detector)exposure, with its calibration group and detector, an objtype column (science / standard, both in the same table), the four macro-step statuses (process→findobj→skysub→extract) as color+glyph cells, the object countnobj, and whether thespec2d/spec1dproducts exist. It is scrollable for runs with many frames. In a folder that has not been reduced yet, the table lists the planned science and standard frames (read from the.pypeitfile) with every stepundone, so you can see what is coming — the science counterpart of the planned calibrations.Detail panel for the selected frame:
View spec2d — opens the 2D spectrum (
pypeit_show_2dspec); enabled when the product exists.(Re)Build — per step (
process/findobj/extract), a blue control that re-runs that science step for the frame via Step by Step Reductions, governed by the same single-run lock as the calibrations (Re)Build (it turns orange “⏳ Run in progress” while a run is active). A step is enabled only when its prerequisite step has succeeded and the frame’s calibrations have been built successfully — until then the (Re)Build is disabled (a science step cannot run without its calibrations).Per-slit table — one row per slit with its status (
BADSKYSUB/BADEXTRACTflagged) and object count.Per-object table — one row per detected object (
snr_find,s2n, spatial position, FWHM, sign, extracted); double-click a metric cell to view that object’s 1D spectrum (pypeit_show_1dspecon the selected object), or itsobj_prof/obj_tracecell to open that object’s QA figure.QA files — all of the frame’s science QA PNGs (the per-object
obj_prof/obj_tracefigures and thespec_flex_*flexure figures); double-click to open one full size, as in the Calibrations view.
Selecting a frame uses a neutral (soft blue-grey) highlight, the same across all of the dashboard tables, so a selected row reads as “selected” rather than as a problem.
The Science status feed comes from the same reduction state (see
PypeIt Reduction State); a normal run_pypeit records it live, and a launch with no
state file derives it from the on-disk spec2d/spec1d (and any
Intermediate/ files). Like the calibrations, the Science view auto-updates
during a run (Live monitoring).
Actions
Control |
Action |
|---|---|
Calibration-group / Detector drop-downs |
Scope the table / detail to one |
Navigator cell (Status view) |
Click to scope to that |
Refresh (Status view) |
Re-read the state file (or re-derive it) and re-render; the status bar reports which source was used. |
Step button (Calibrations view) |
Select the step and show its detail panel. |
Inspect output |
Launch the step’s viewer as a subprocess. |
(Re)Build (Calibrations) |
Regenerate the selected calibration via pypeit_run_to_calibstep (with a clobber confirmation); disabled while a run is active. |
Input-file / QA entry (double-click) |
View the raw frame ( |
Science navigator cell (Status view) |
Switch to the Science view and select that |
View spec2d (Science view) |
Open the frame’s 2D spectrum ( |
Object row (double-click, Science view) |
View that object’s 1D spectrum ( |
(Re)Build (Science view) |
Re-run a science step for the frame via Step by Step Reductions; enabled only once the frame’s calibrations are built (and its prerequisite step); disabled while a run is active. |
Run PypeIt (Science view) |
Run the full reduction ( |
Live monitoring
While a reduction is running — whether you launched a (Re)Build from the
dashboard or started run_pypeit / pypeit_run_to_calibstep in a terminal —
the dashboard auto-updates: as PypeIt writes the reduction state on each step
transition (see PypeIt Reduction State), the Status table, summary, navigators, the
Calibrations button row, and the Science view refresh on their own, with
no manual Refresh. You watch each calibration — and each science step — go
white → orange (running) → green (success) live.
How it works and what to expect:
A run is detected by watching the reduction
.log(it is written continuously while running); while active, the dashboard polls the*_state.json(every ~2 s) and re-renders only when it actually changes.The live refresh preserves your scope (group/detector) and selected step, so it does not yank the view around — and you can still inspect already-built calibrations while later steps build (inspection feedback uses the separate Inspection status channel).
The Build status channel shows “Monitoring run — updating live…” while a run is active and returns to “Idle” when it finishes (with one final refresh).
Mid-run, the state is read from
*_state.json(never re-derived).
Not yet implemented
The dashboard is built up in stages. The following are planned but not part of this version:
A log view that tails the reduction
.logwhile running.Deferred per-object science metrics (
OPT_CHI2,WAVE_RMS, flexure) and mosaic-detector science derivation from disk.
Architecture
The dashboard follows a Model–View–Controller organization:
a headless model (
pypeit.dashboard.model.DashboardModel) that loads or derives the reduction state and exposes it as clean, Qt-free data (the calibration status table, the(calibration group, detector)pairs, the path-aware step order, per-step metrics, per-slit/order detail, and the per-frame science table with its per-slit/per-object detail);thin Qt views (the Status, Calibrations, and Science tabs) that render what the model provides, coloring everything through the shared status palette;
a launcher (
Launcher) that runs the inspection tools and (re)builds as subprocesses and reports to the shared status bar; anda single-run lock (
RunLock) that detects an active reduction and drives the live monitoring.
For the component graph, the state-acquisition flow, and the live-monitoring / (Re)Build sequence — as diagrams — see PypeIt Dashboard: Design.
See also
PypeIt Dashboard: Design — how the dashboard is built (component, state-flow, and live-monitoring diagrams).
PypeIt Reduction State — the reduction state file the dashboard reads.
PypeIt QA — the QA figures.
Command-line Scripts — the
pypeit_chk_*/pypeit_show_*inspection scripts.PypeIt’s Core Data Reduction Executable and Workflow — the core
run_pypeitexecution.